Which is the Best TradingView Trend indicator? Top 7 picks
Trend trading is one of the most widely used strategies in financial markets, and TradingView provides a versatile platform with a variety of indicators to help traders identify market direction and strength.
Choosing the best TradingView trend indicator can be challenging because the platform offers both popular, widely used indicators and advanced custom tools.
In this guide, we’ll break down 7 popular TradingView trend indicators, introduce custom indicators like Solar Wave, Cosmik Z-TP, and Easy Trend, and show practical ways to use them for more consistent trading results.
Why Trend indicators matter in trading
Before diving into the list, it’s important to understand why traders emphasize trend indicators. A trend indicator helps identify:
- Direction: Is the market bullish, bearish, or consolidating?
- Strength: Is the trend strong enough to trade, or is it losing momentum?
- Entry zones: Areas where pullbacks offer opportunities.
- Exit signals: When the trend weakens or reverses.
Without this framework, traders often get caught in false breakouts, whipsaws, or late entries. That’s why using the right indicators on TradingView can help build confidence and discipline in decision-making.
7 popular TradingView Trend indicators
When it comes to finding the best TradingView trend indicator, traders often start with familiar, reliable tools. These indicators help you identify the direction of the market, assess momentum, and make informed entry and exit decisions.
Let’s break down 7 popular indicators that consistently perform well on TradingView.
1. Moving Averages (MA, EMA, SMA)
Moving averages are one of the most widely used tools for trend analysis and are a key part of any trend-following strategy. They help smooth out short-term price fluctuations and reveal the overall market direction, making it easier to align trades with the dominant trend.
- Simple Moving Average (SMA): Provides a clear picture of the long-term trend. Price above the SMA suggests bullish conditions, while price below indicates bearish momentum.
- Exponential Moving Average (EMA): Gives more weight to recent price action, reacting faster to changes. This makes it ideal for short-term trend analysis and identifying pullback opportunities.

How to use: A common approach is to combine a long-term SMA with a short-term EMA. The SMA sets the trend bias, and the EMA helps pinpoint entry points, allowing traders to enter trades in the direction of the prevailing trend.
This approach is common, but not universal. Some traders prefer using EMA for both long and short-term trends, while others stick with SMA for consistency. The key is to choose settings that align with your strategy and timeframe.
2. Relative Strength Index (RSI)
The RSI is a momentum oscillator that measures the speed and change of price movements. While traditionally used to spot overbought or oversold conditions, RSI can also be applied to trend analysis.
- Traders typically look at RSI levels of 70/30 or 80/20 to identify overbought and oversold zones.
- Divergence between RSI and price can indicate a weakening trend or potential reversal.

Traders using the best TradingView trend indicator setups often combine RSI with moving averages or Bollinger Bands to filter out noise and improve the accuracy of entries.
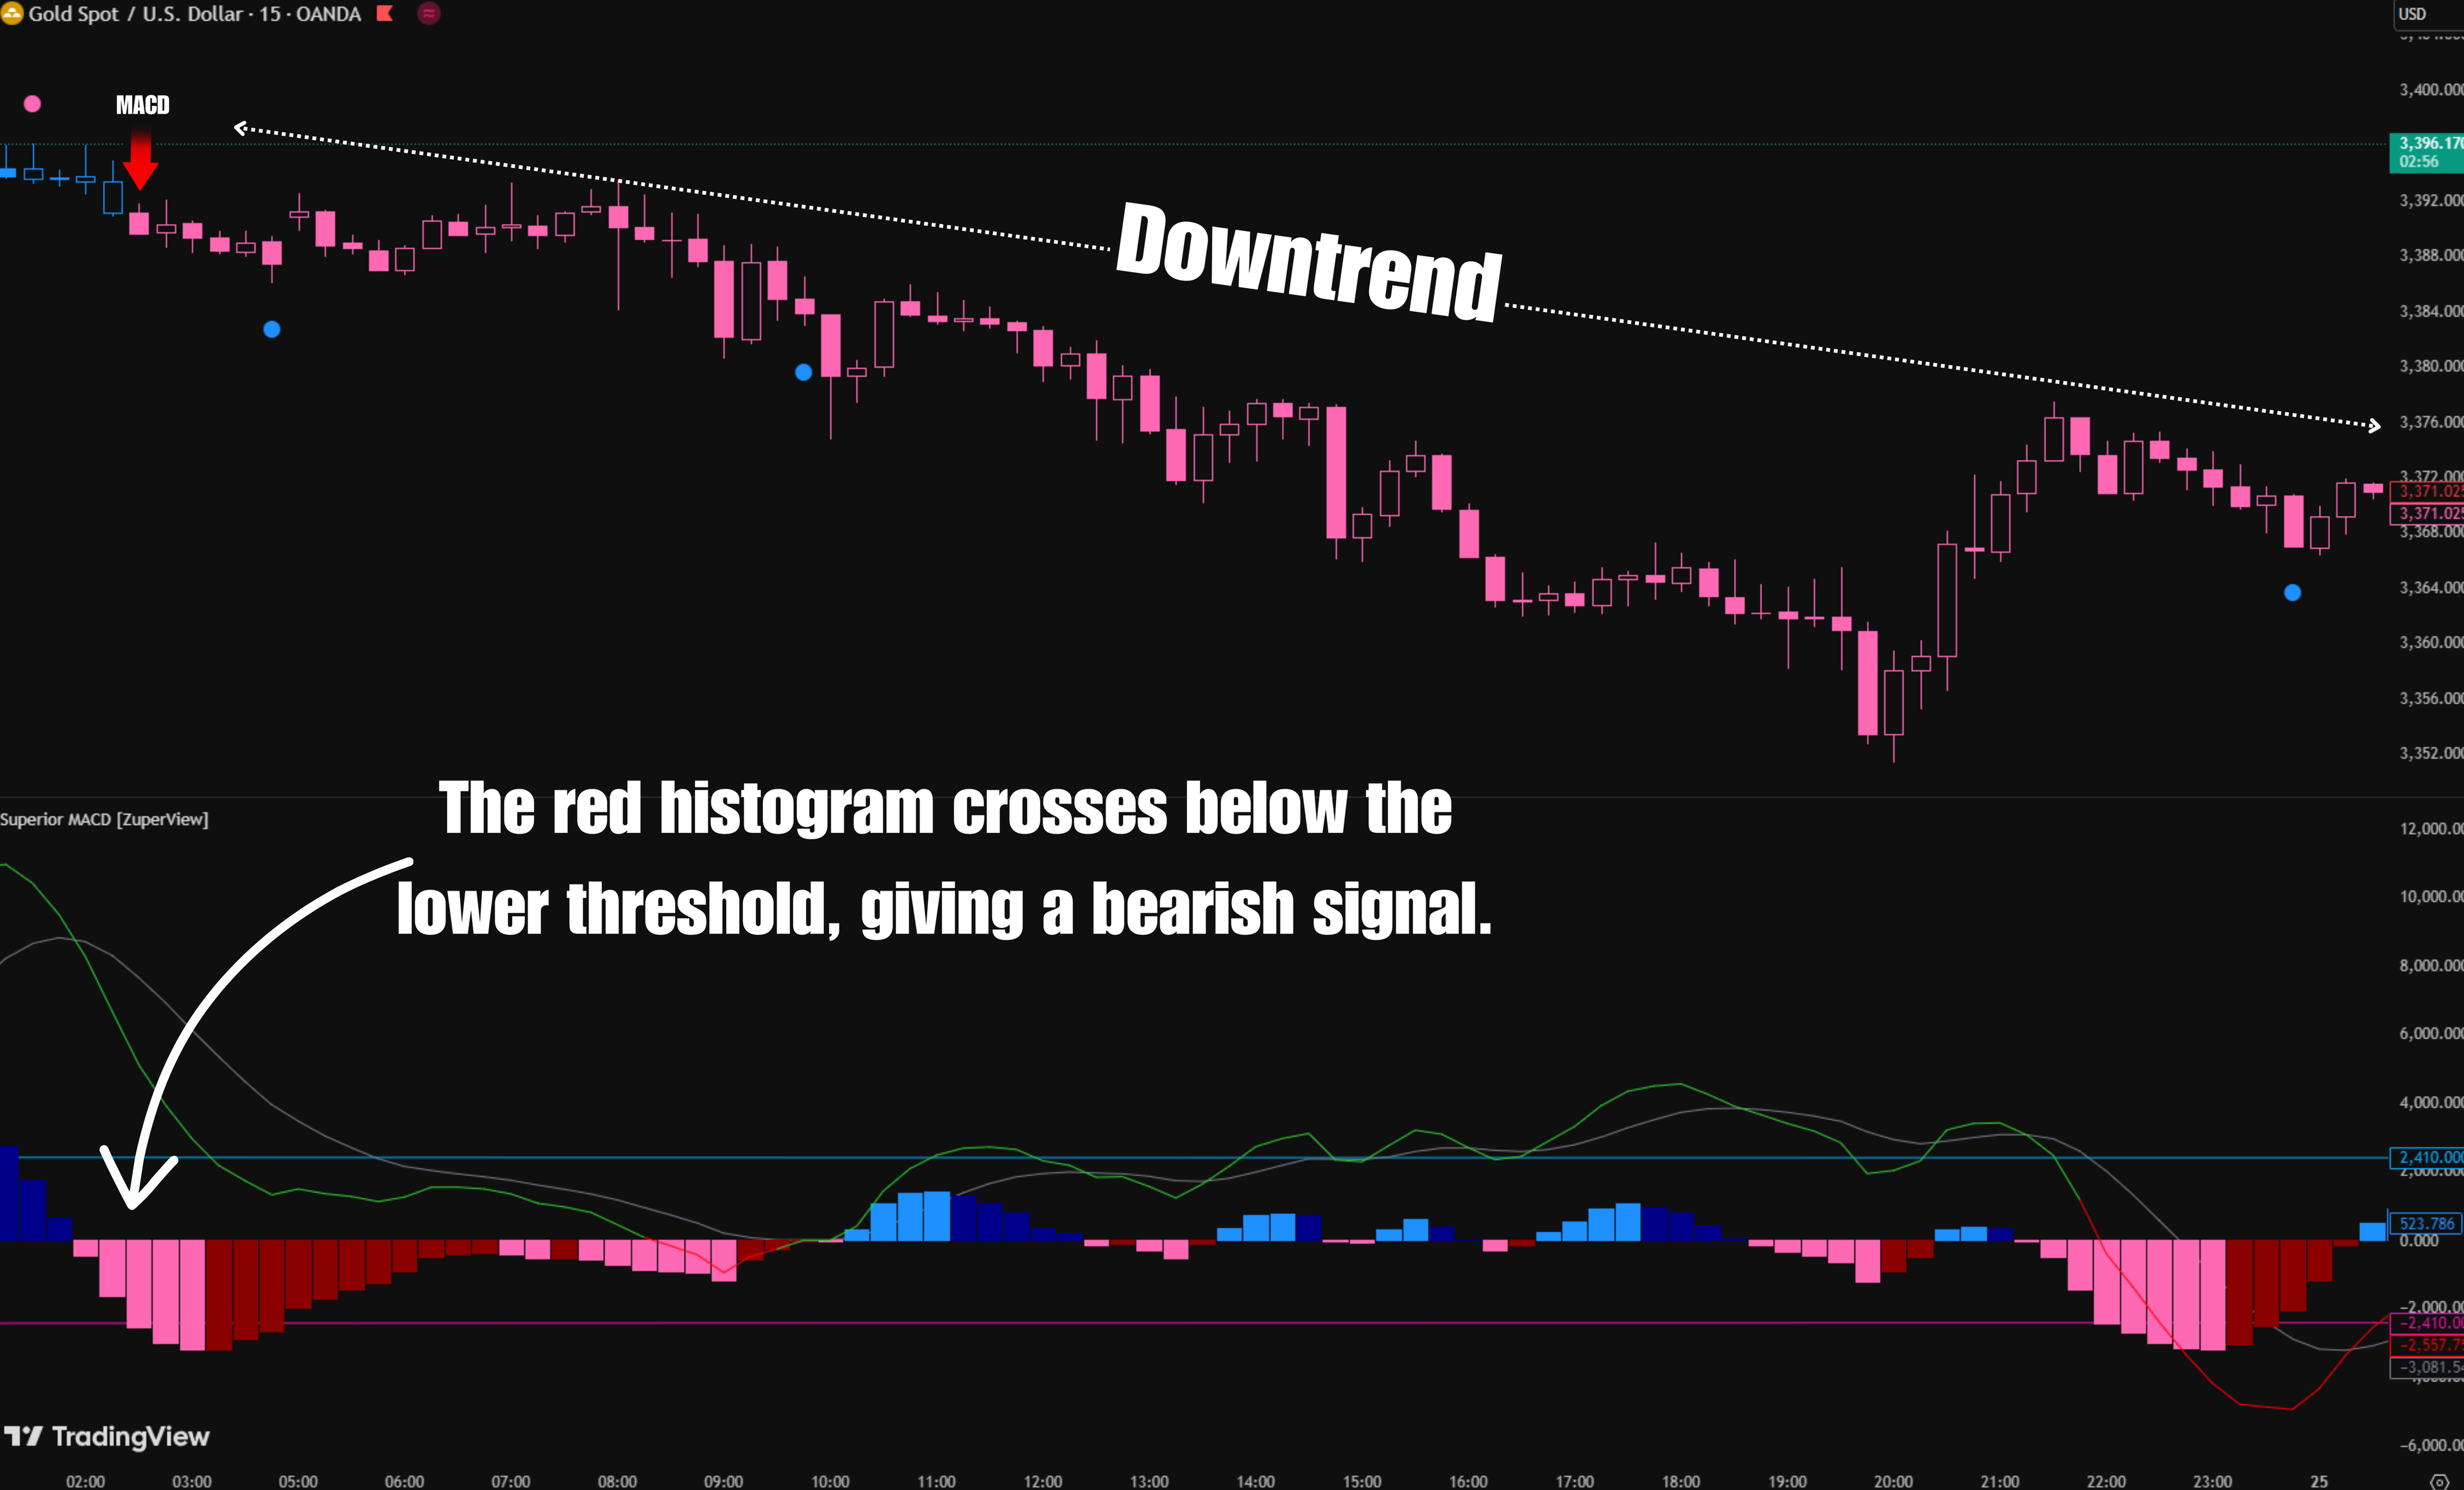
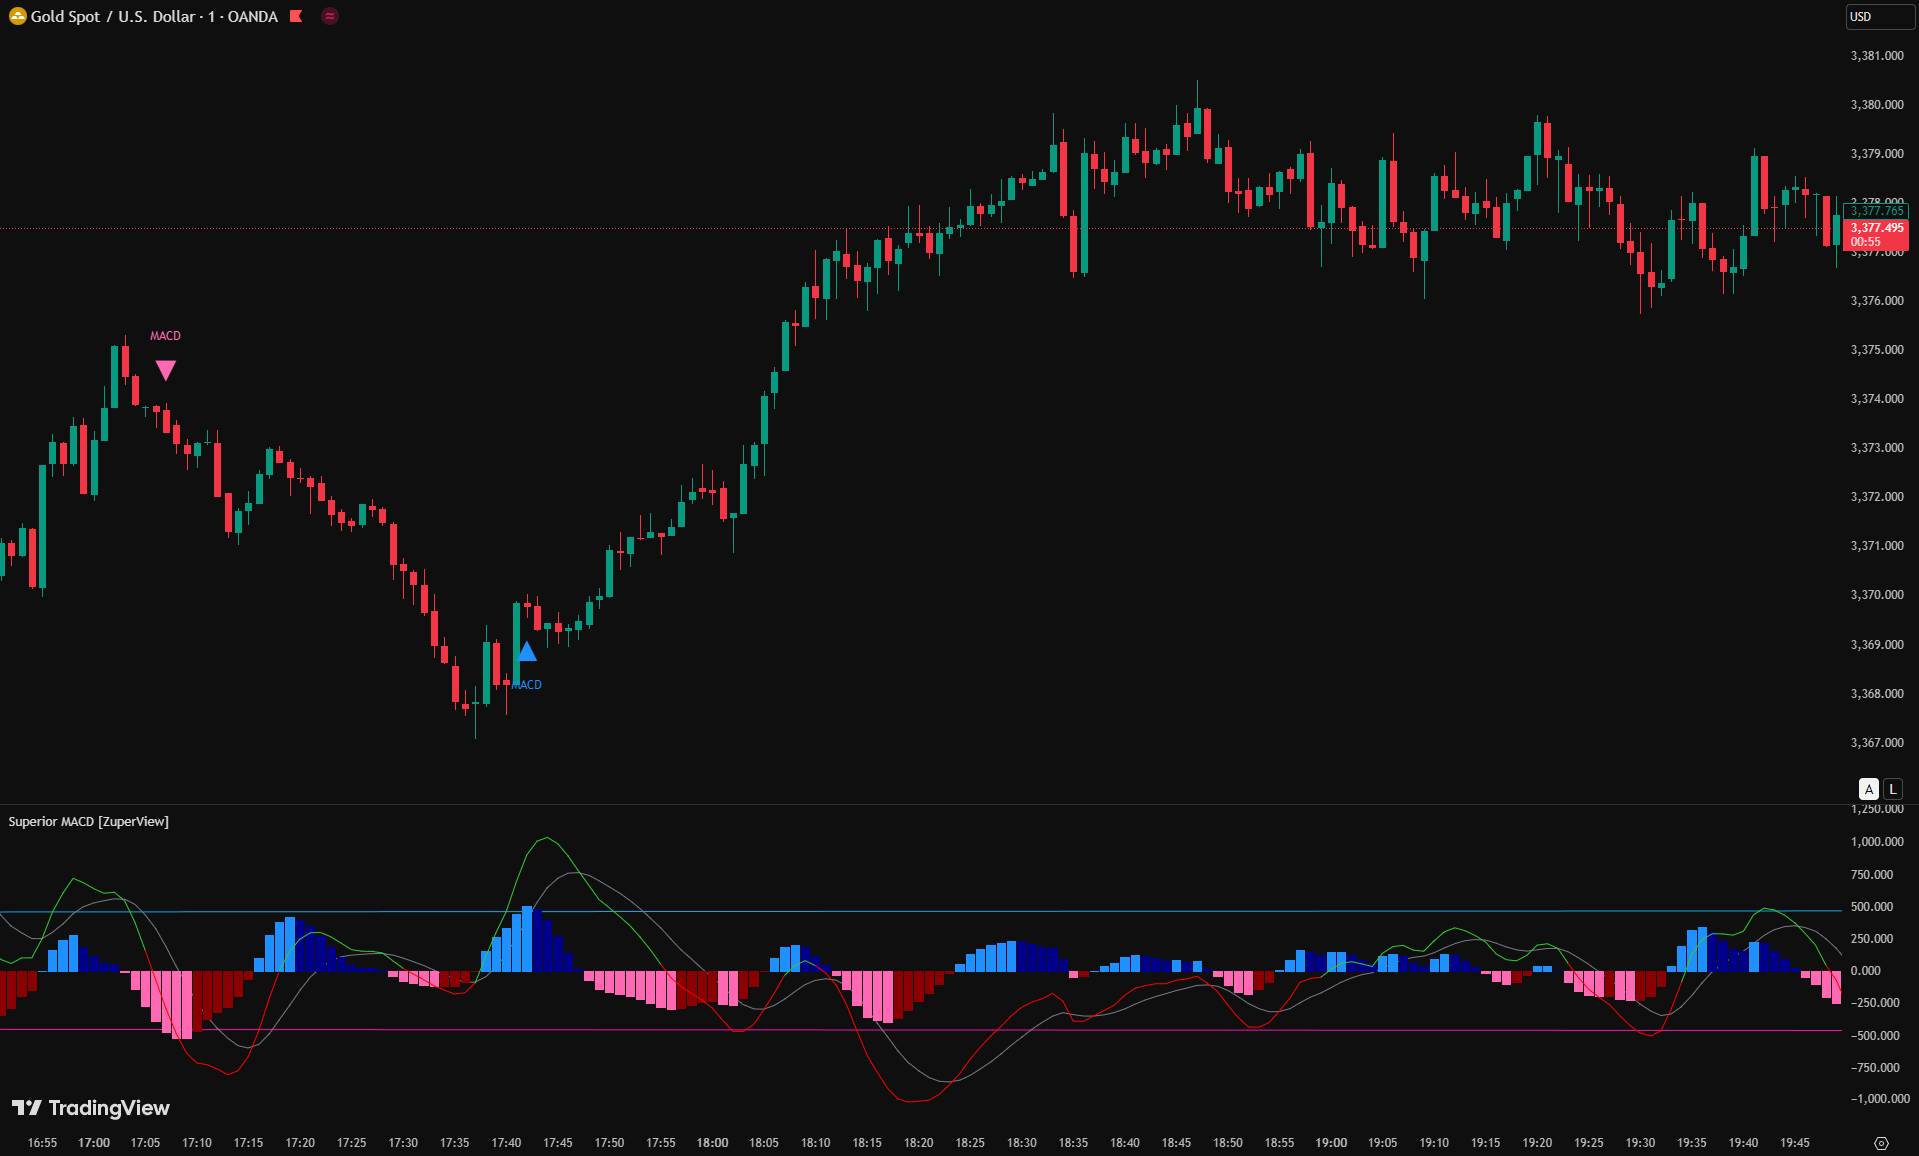
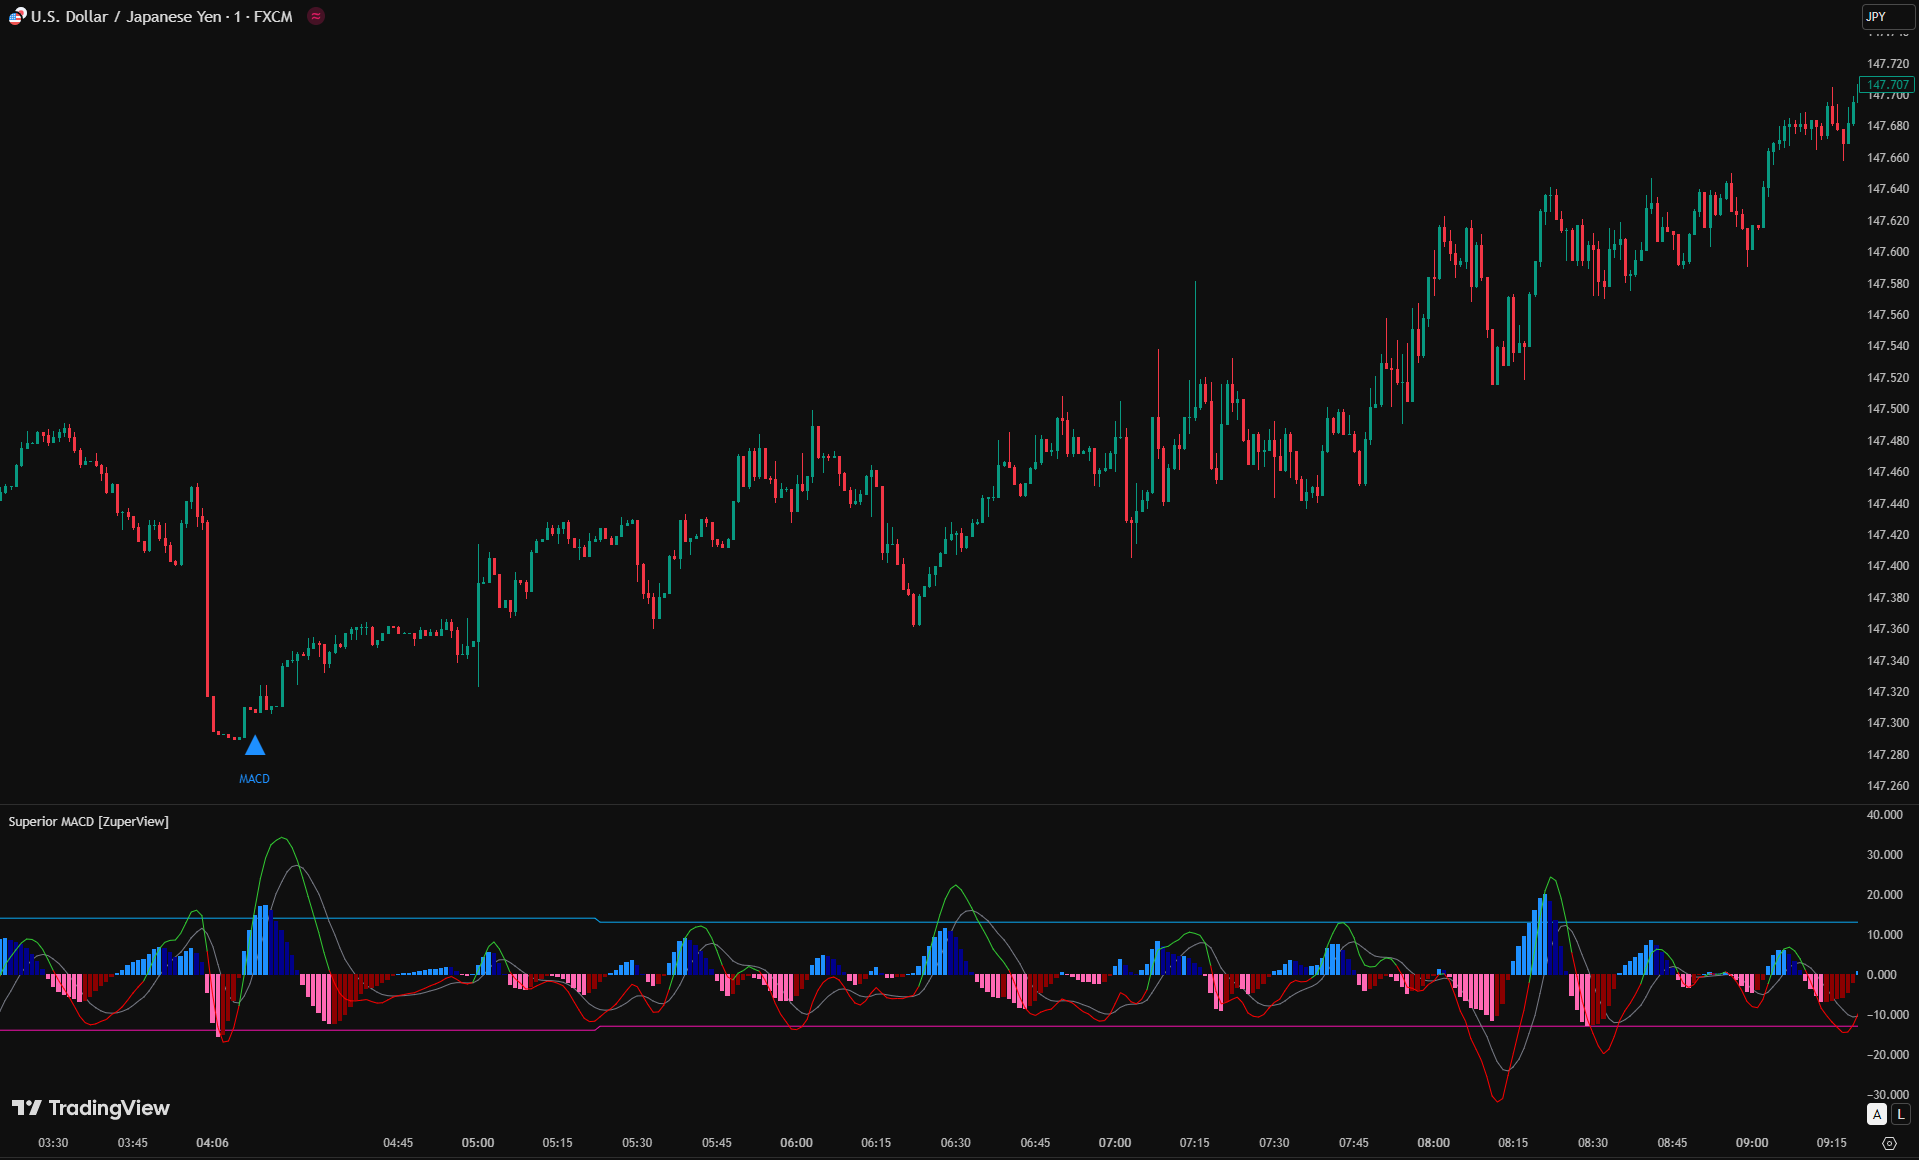
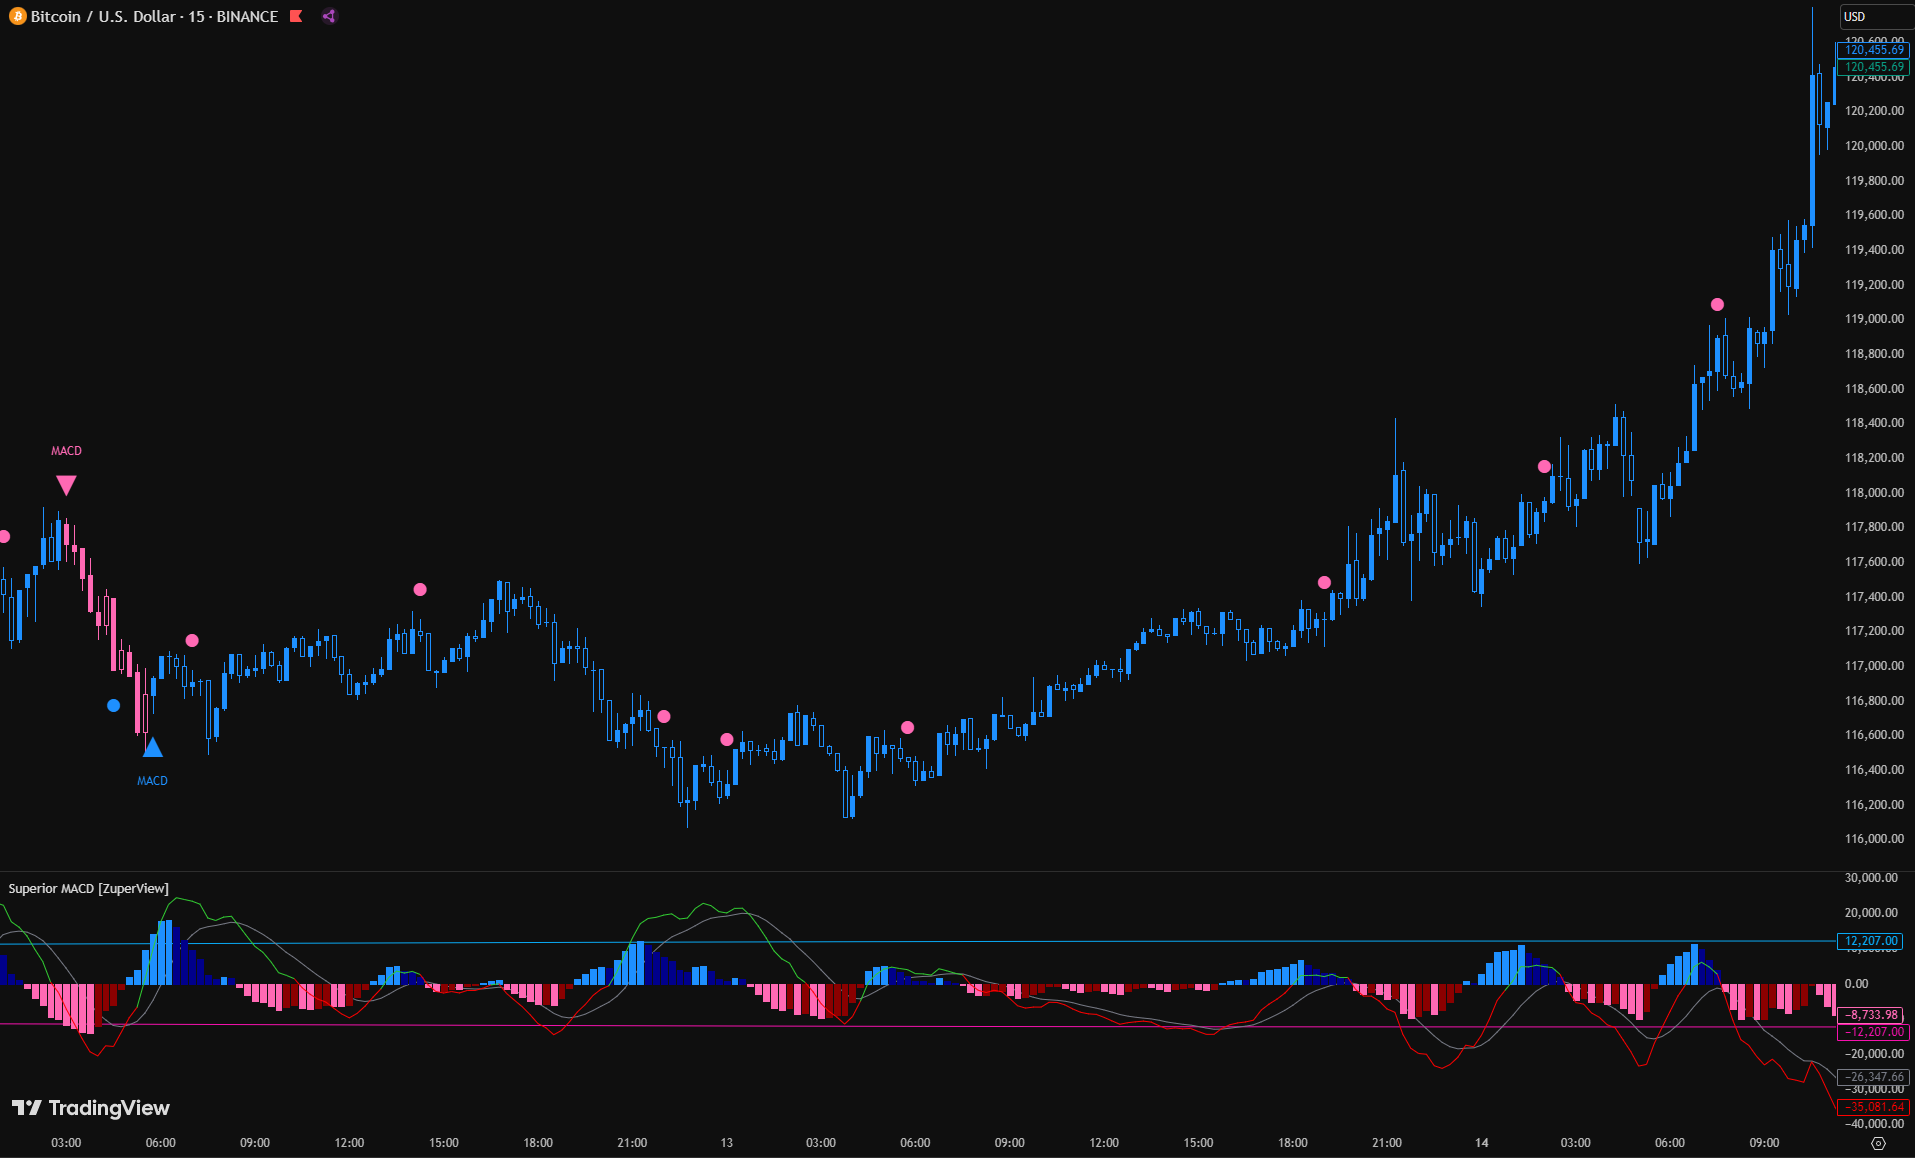
3. Moving Average Convergence Divergence (MACD)
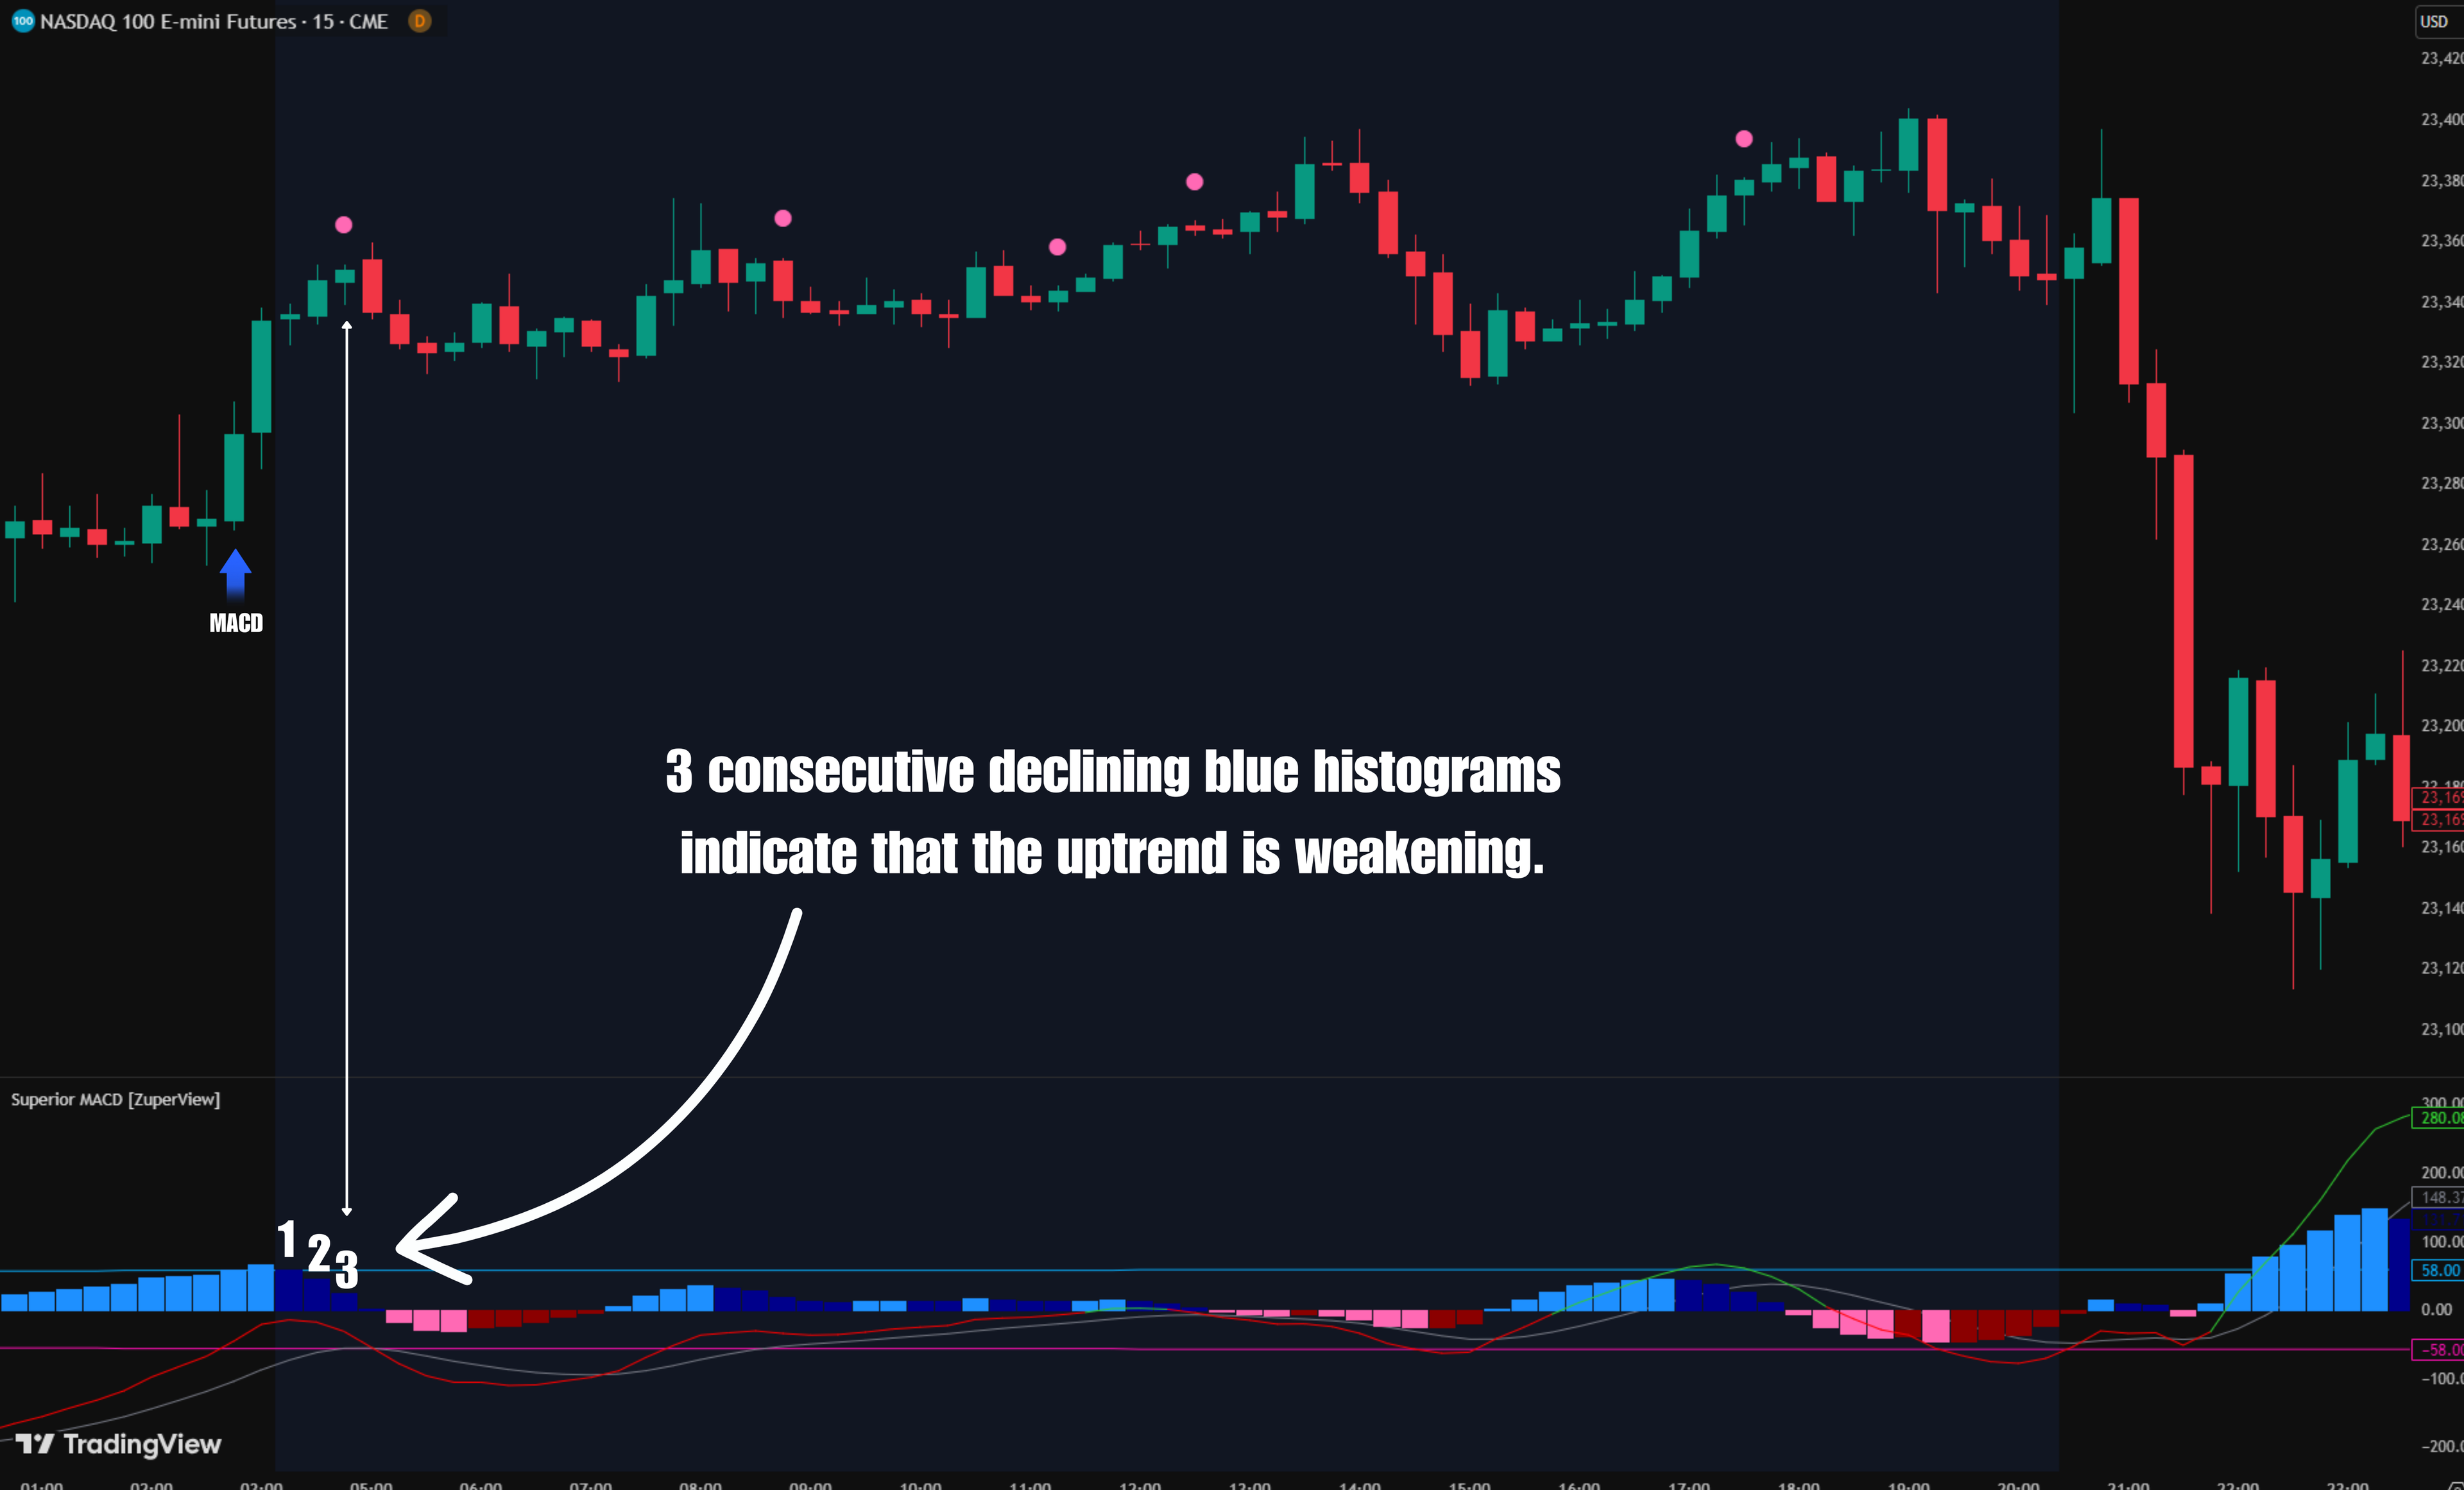
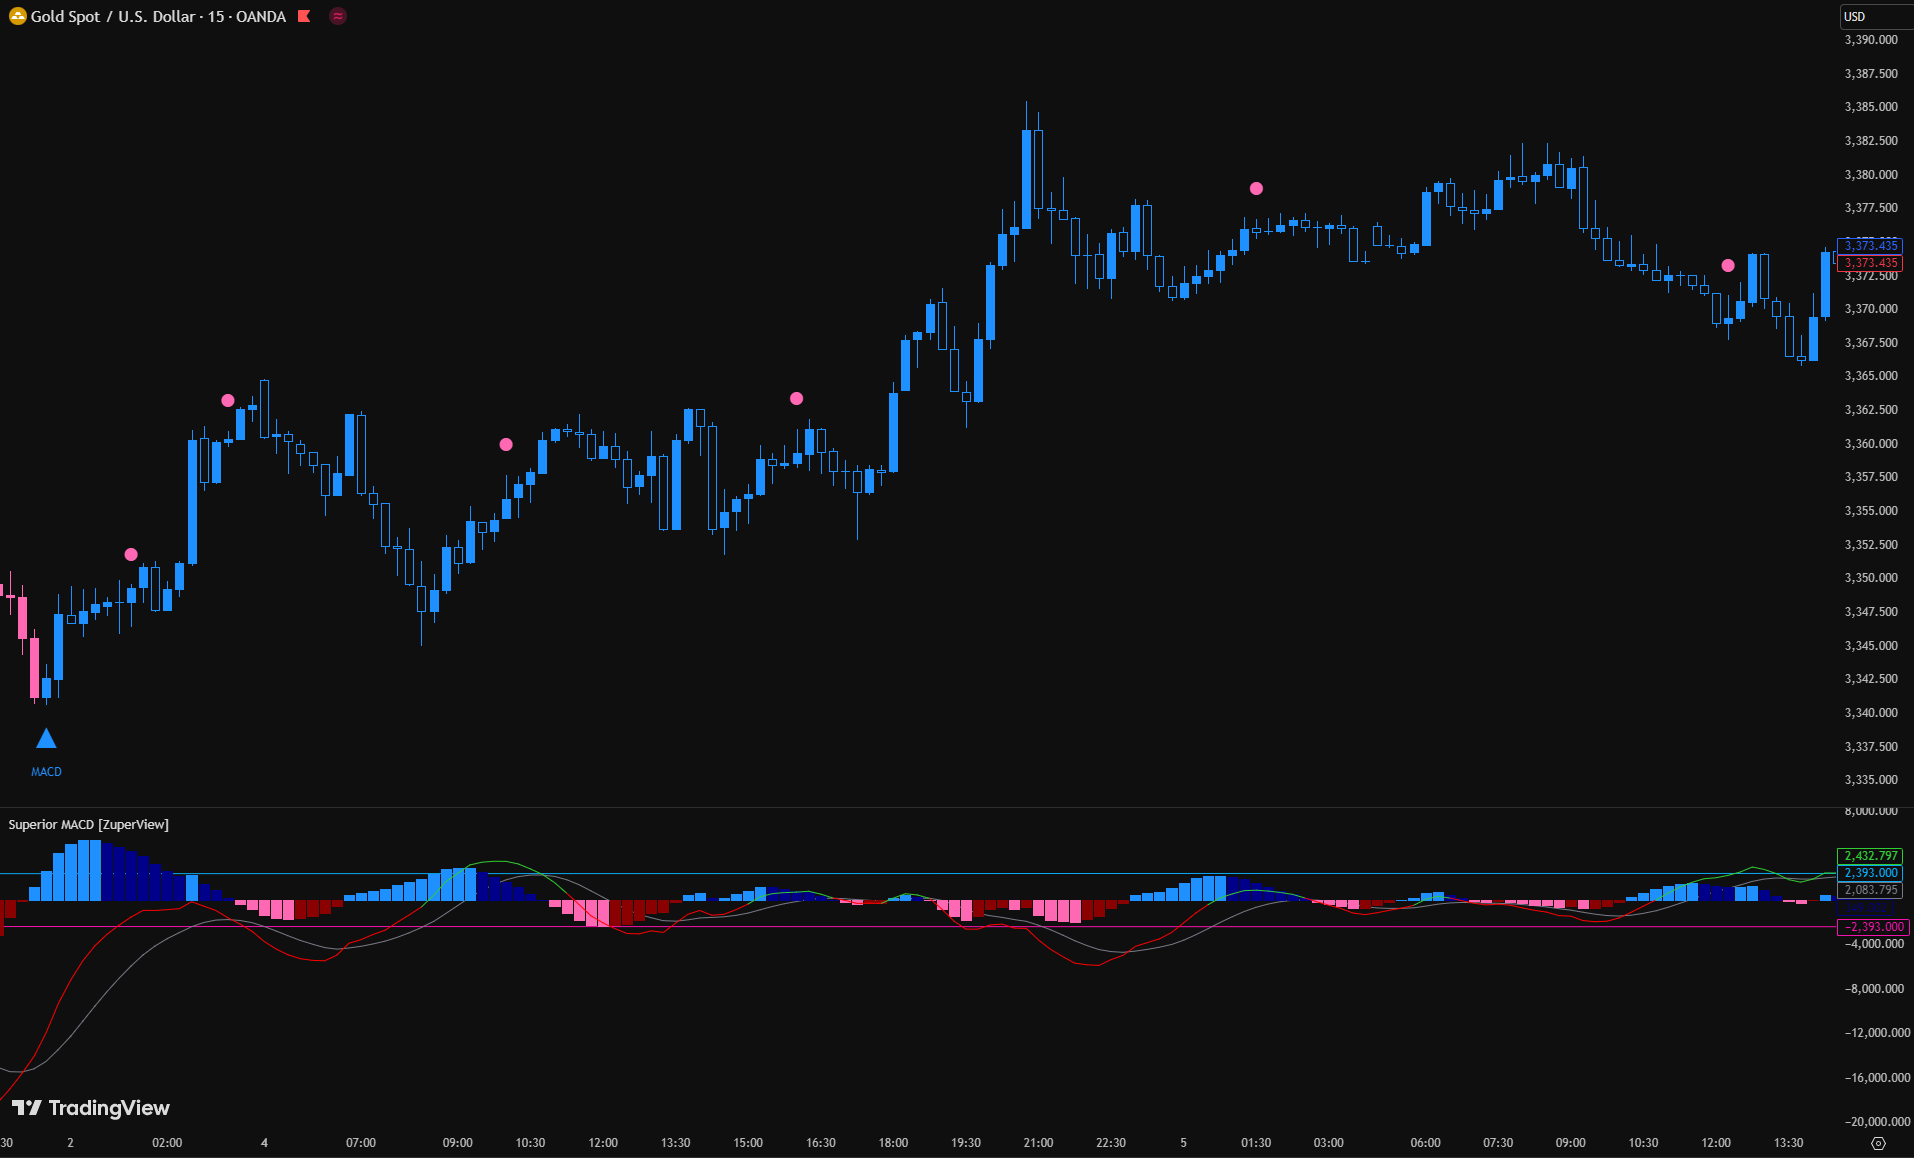
MACD is a versatile trend-following and momentum indicator that calculates the difference between two EMAs. It comes with a signal line and histogram for added clarity.
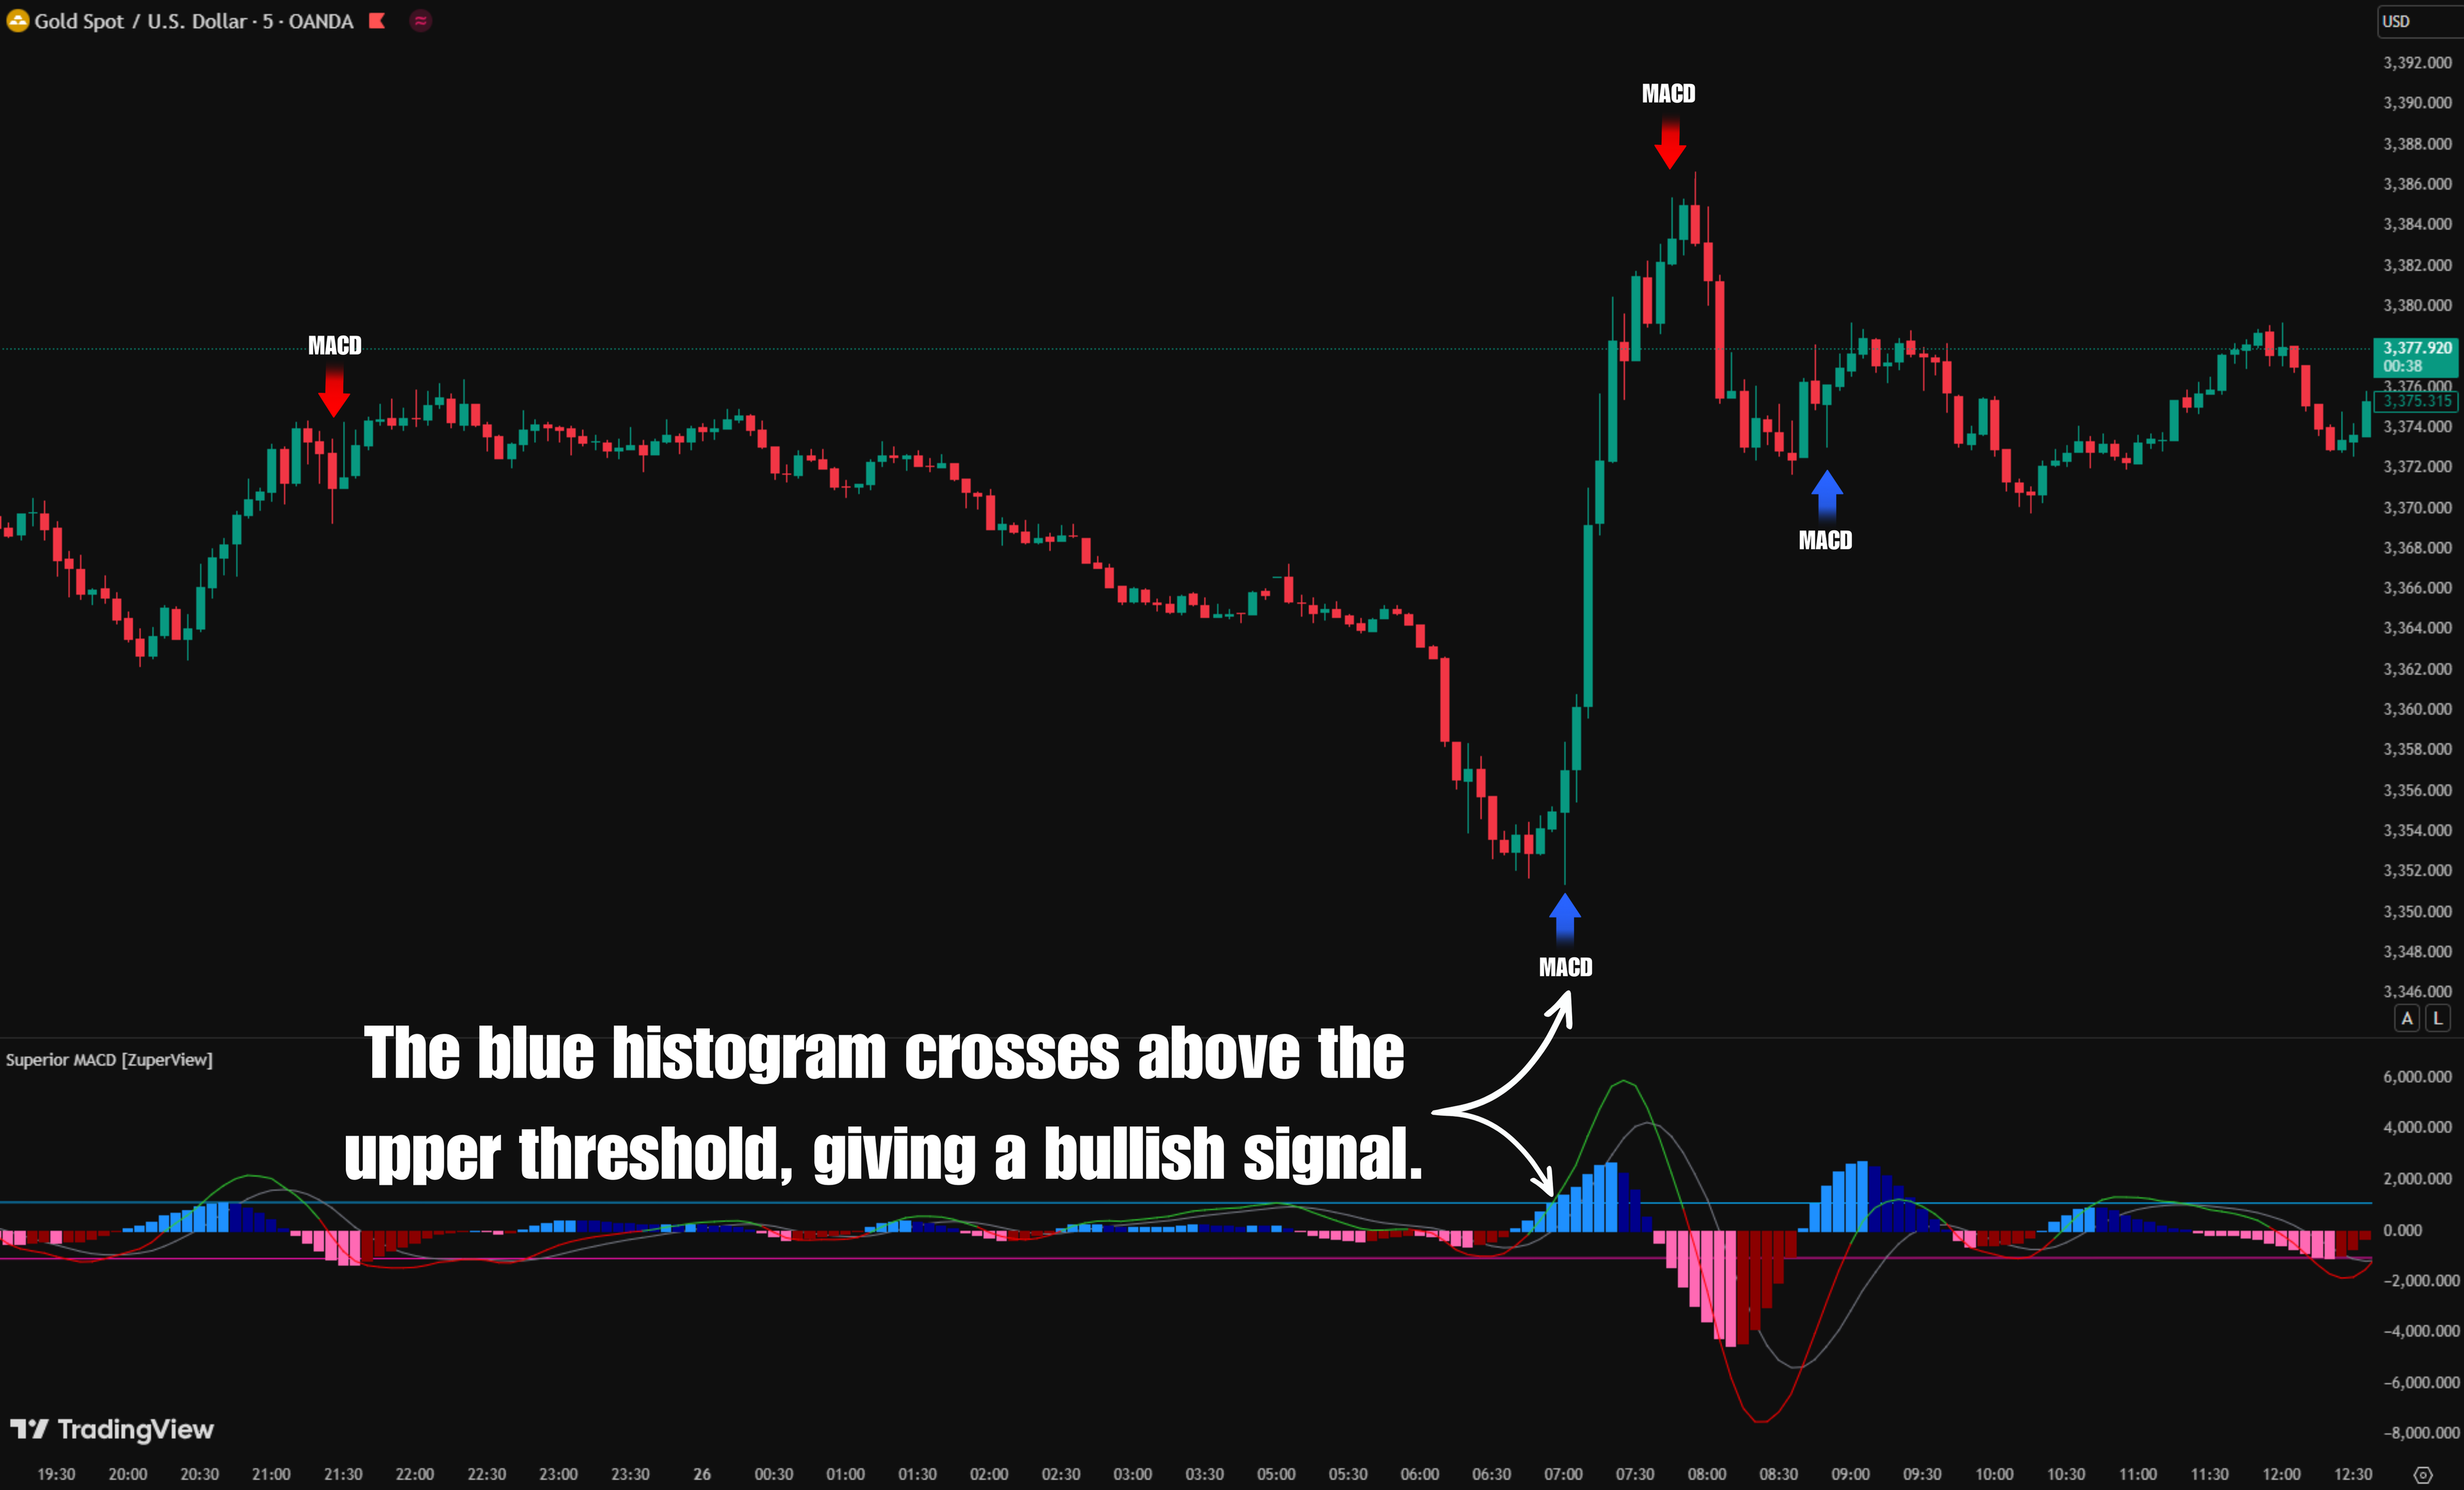
- When the MACD line crosses above the signal line, it suggests bullish momentum.
- When it crosses below, it indicates bearish momentum.

MACD is particularly useful in trend strategies as it helps identify both the trend direction and the strength of that trend, making it a staple in many traders’ toolkits.
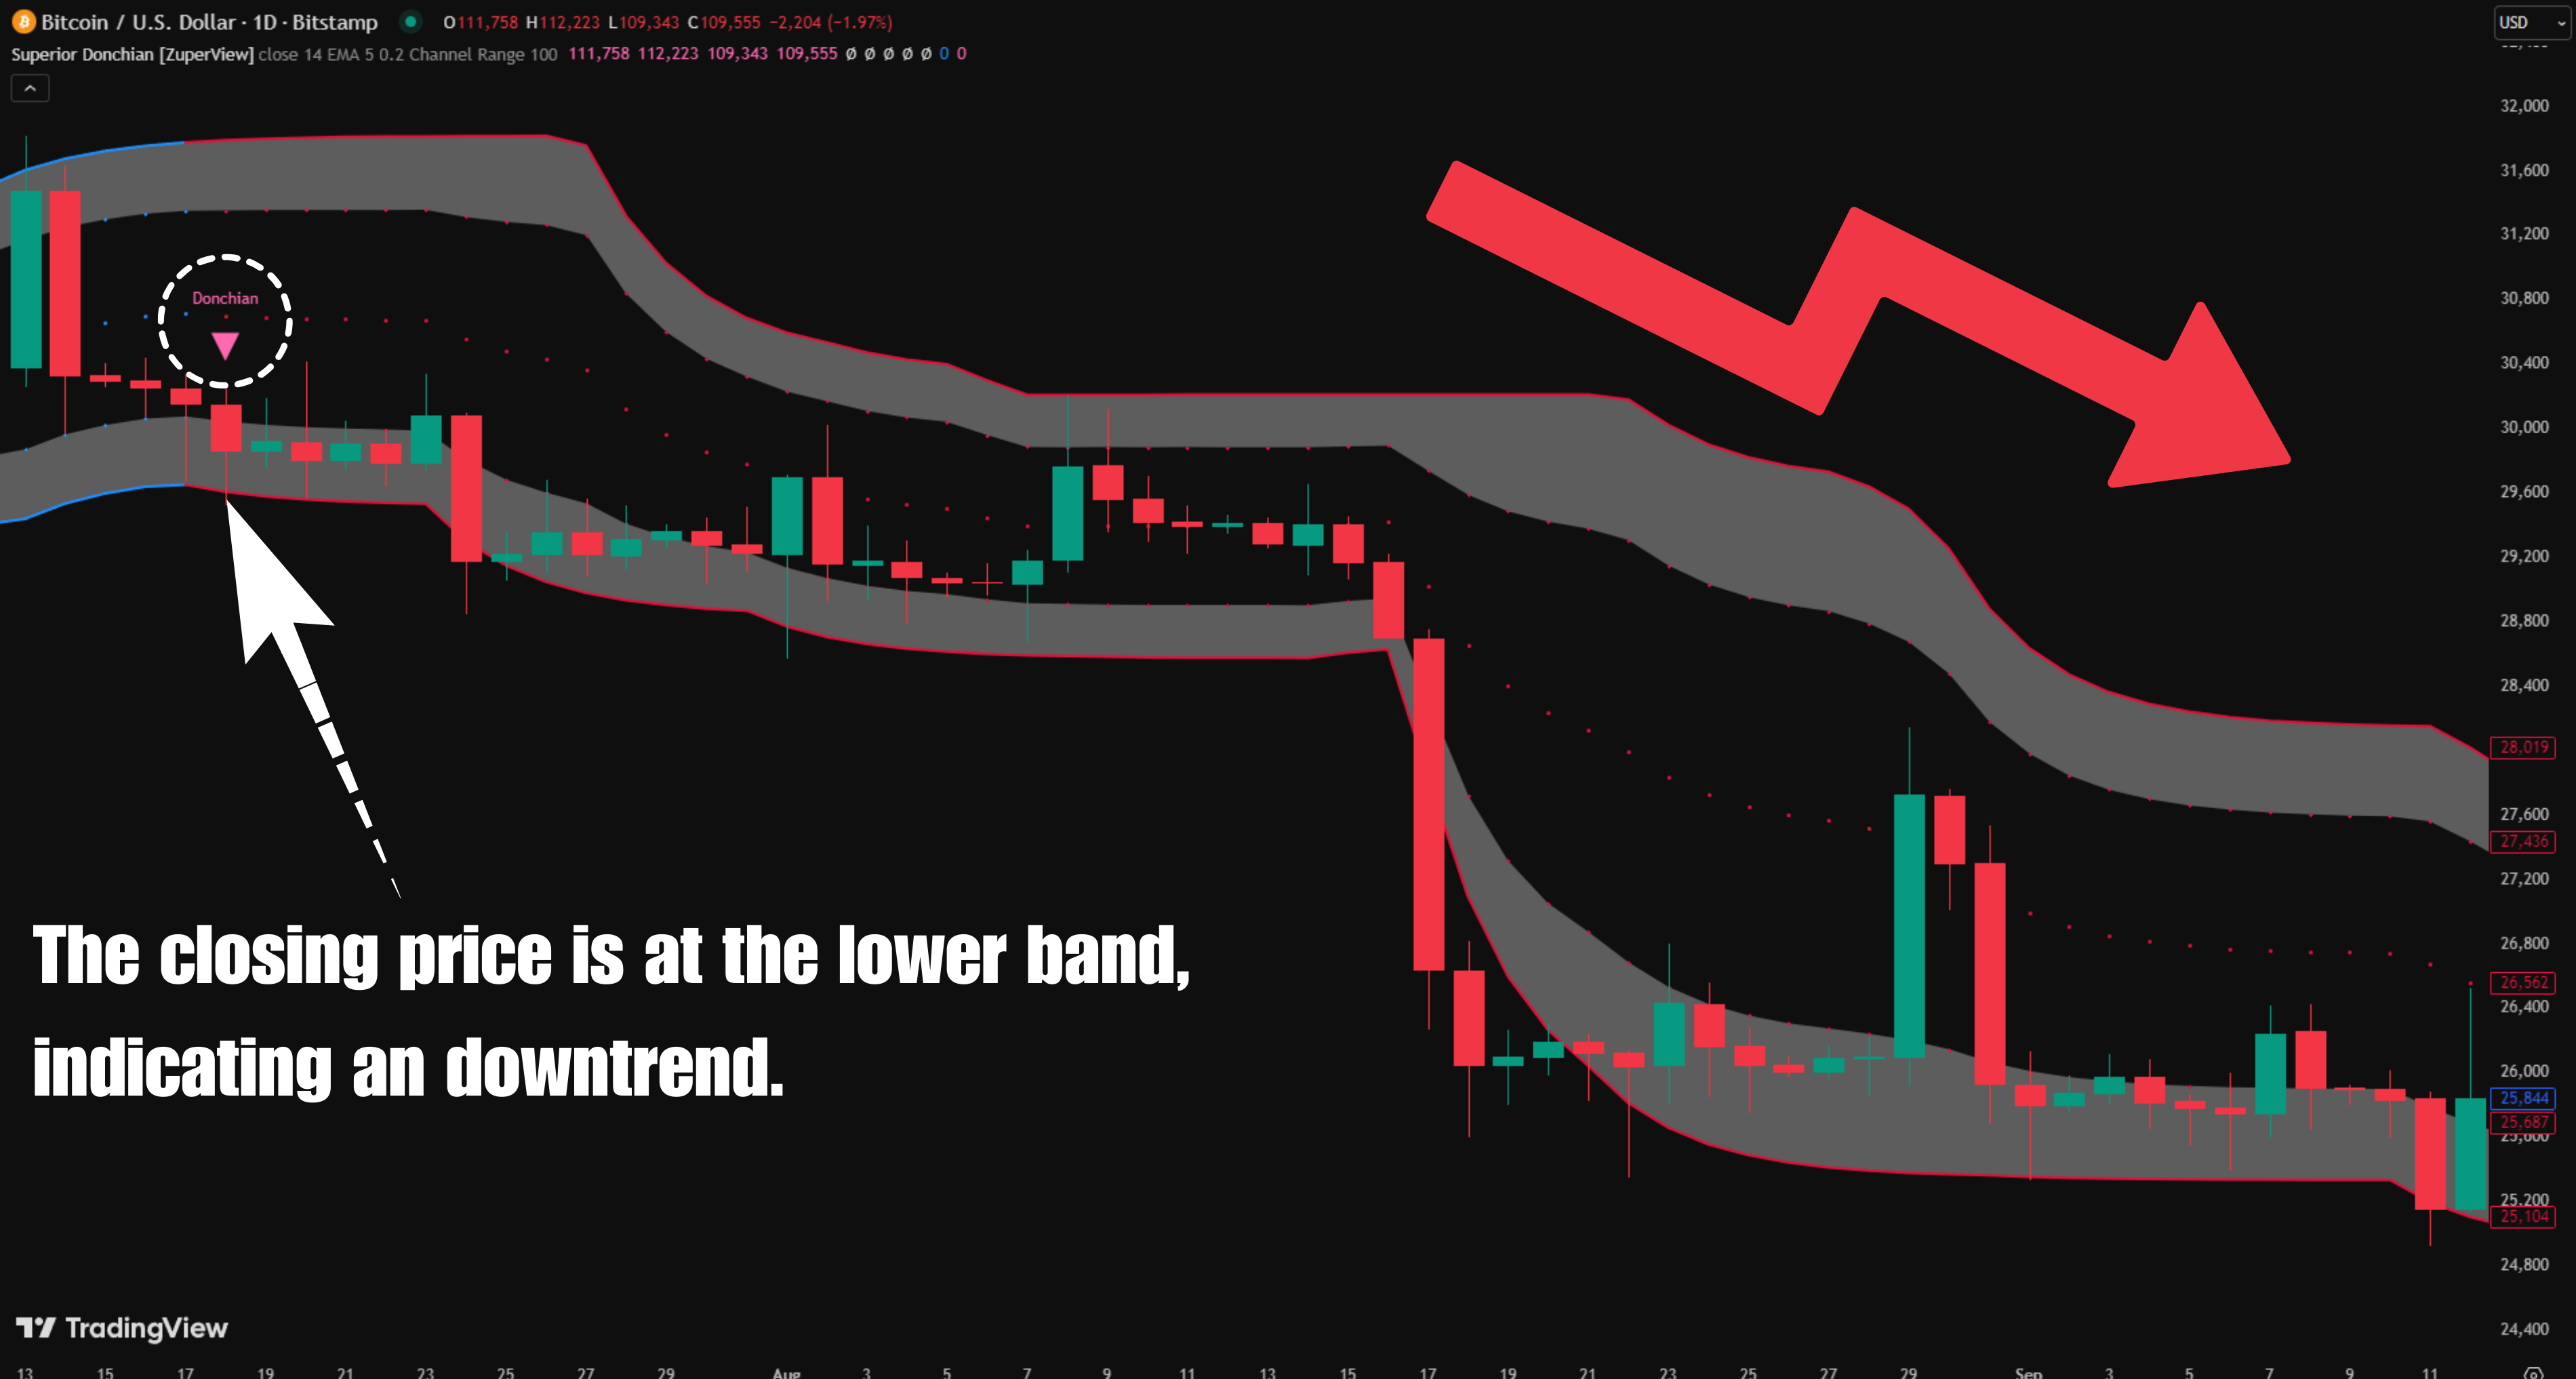
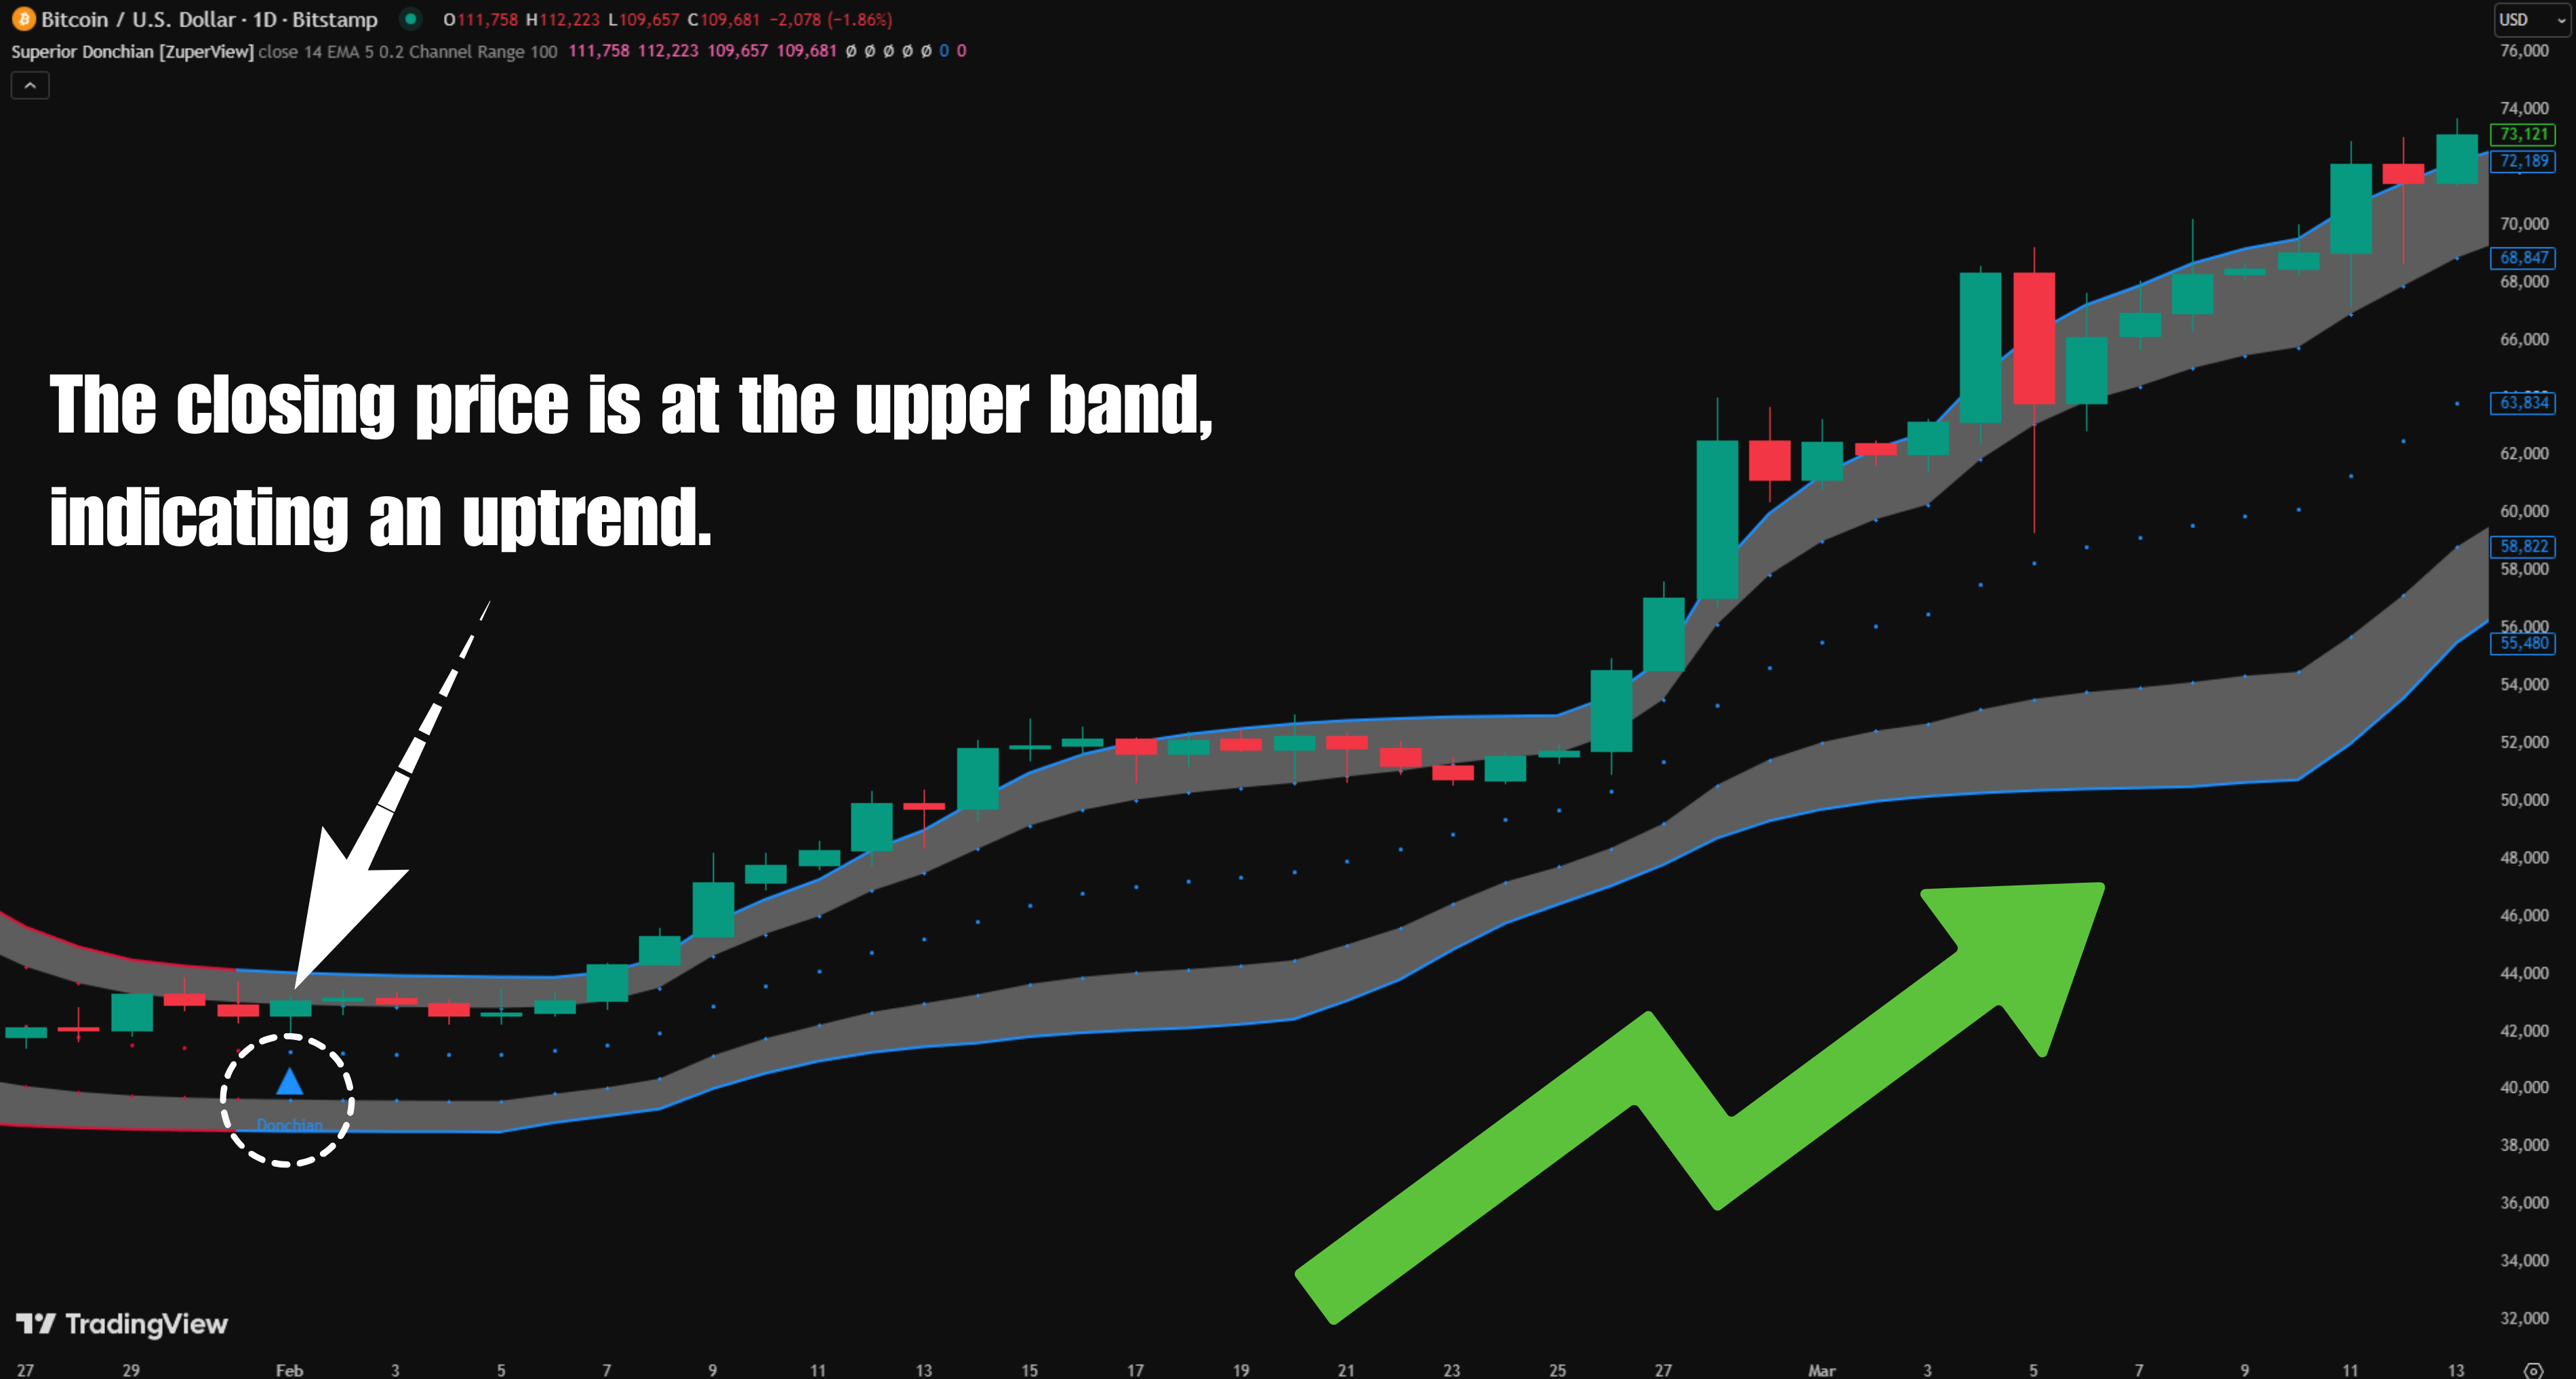
4. Bollinger Bands
Bollinger Bands use a moving average (usually a 20-period SMA) with upper and lower bands set by standard deviations to measure market volatility. When the bands expand, volatility is rising and trend continuation is more likely; when they contract, the market is typically ranging or consolidating.
- In an uptrend: look for long entries on pullbacks toward the middle band (the SMA). Treat the middle band as dynamic support – enter when price retraces near it and then resumes upward toward the upper band.
- In a downtrend: look for short entries when price retraces toward the middle band and then continues downward toward the lower band. The middle band acts as a dynamic resistance in this case.

Many traders combine Bollinger Bands with momentum or confirmation tools (RSI, MACD, or volume-based indicators) to filter false signals and build a more robust trend-following setup.
5. Volume-based Indicators
Volume is a critical factor in confirming trends. Popular volume-based indicators include On-Balance Volume (OBV) and Volume Weighted Average Price (VWAP).
- Rising volume in the direction of the trend strengthens the validity of the move.
- Divergences between price and volume may indicate a weakening trend or potential reversal.

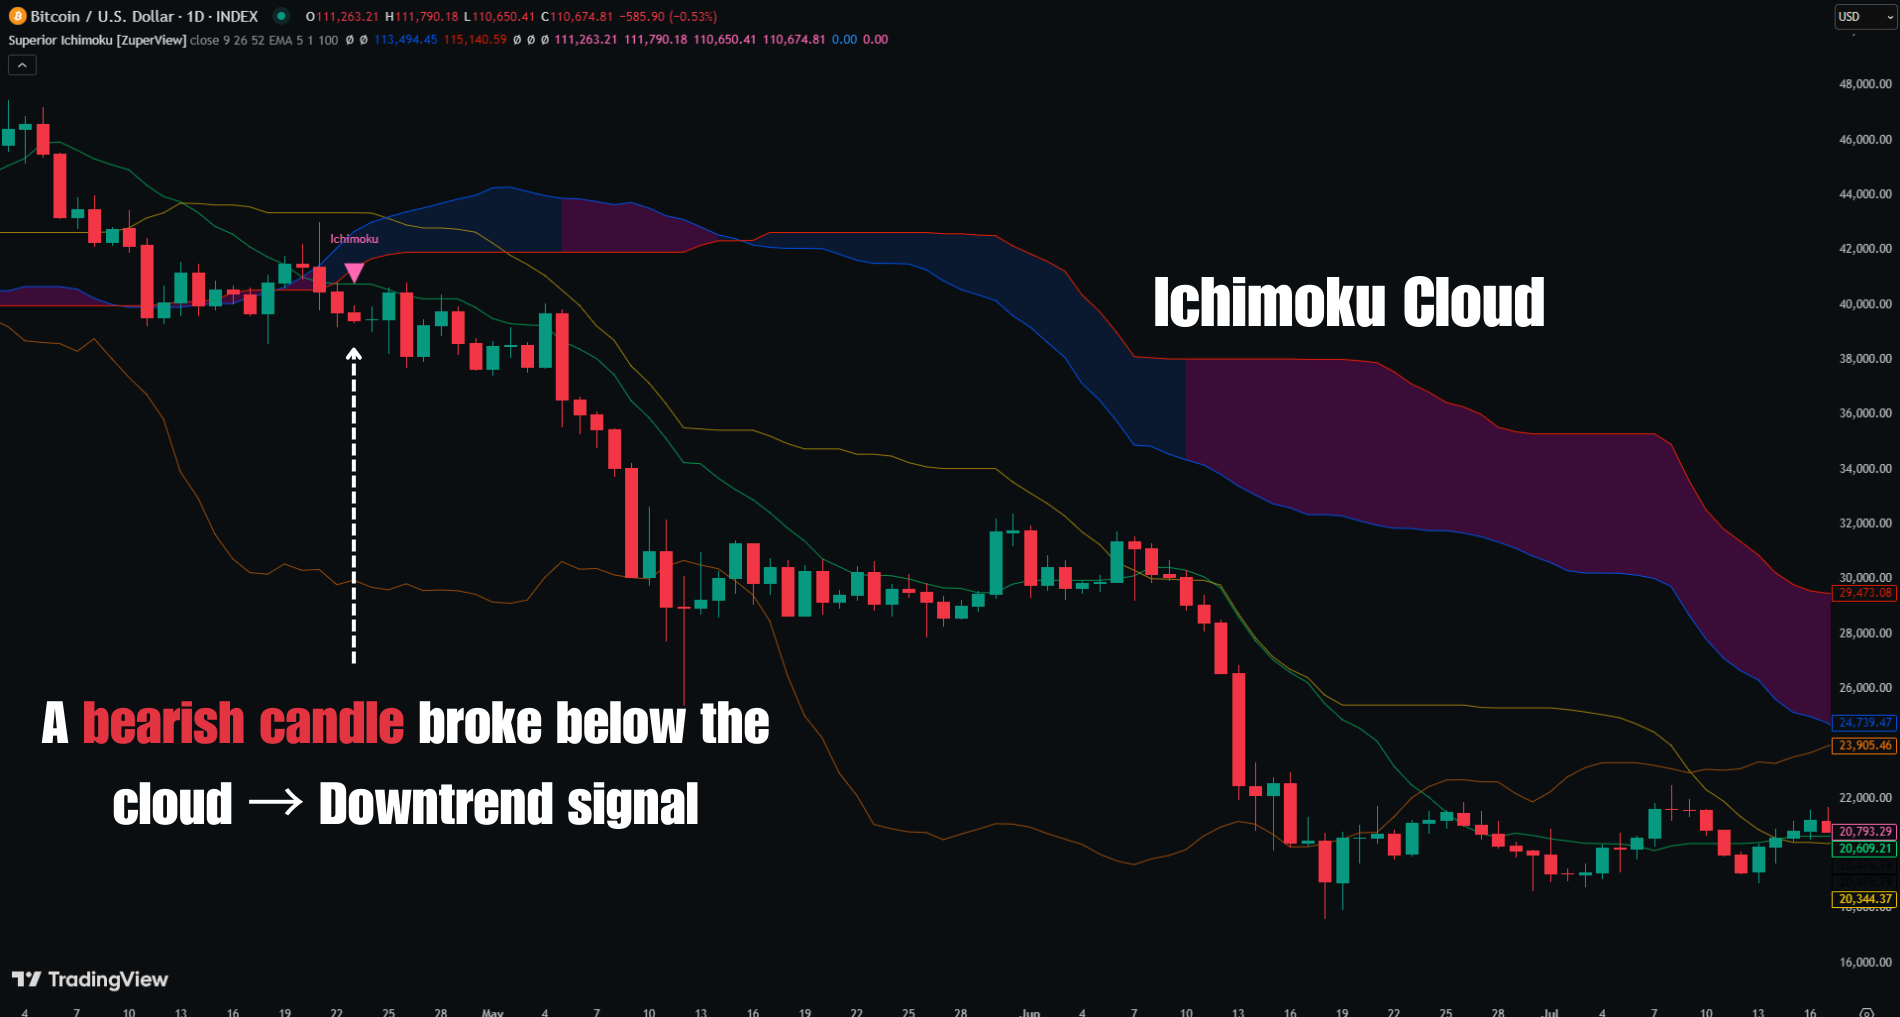
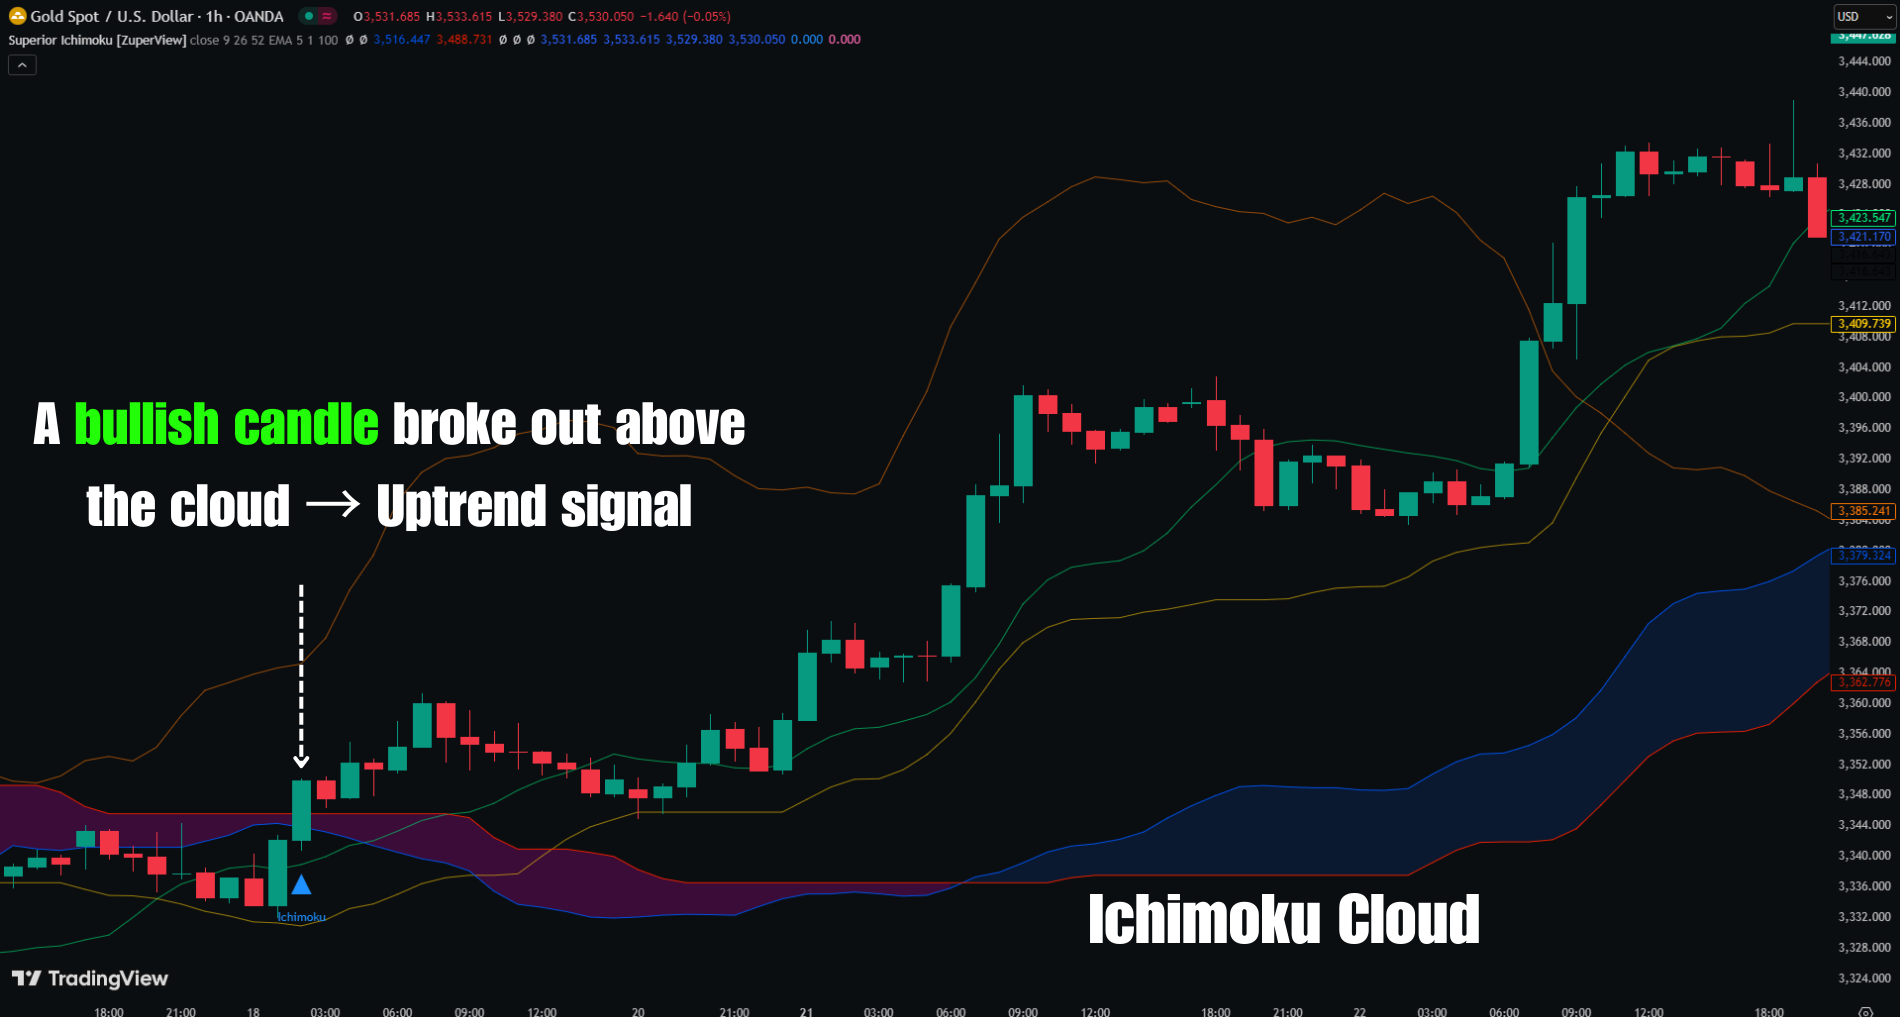
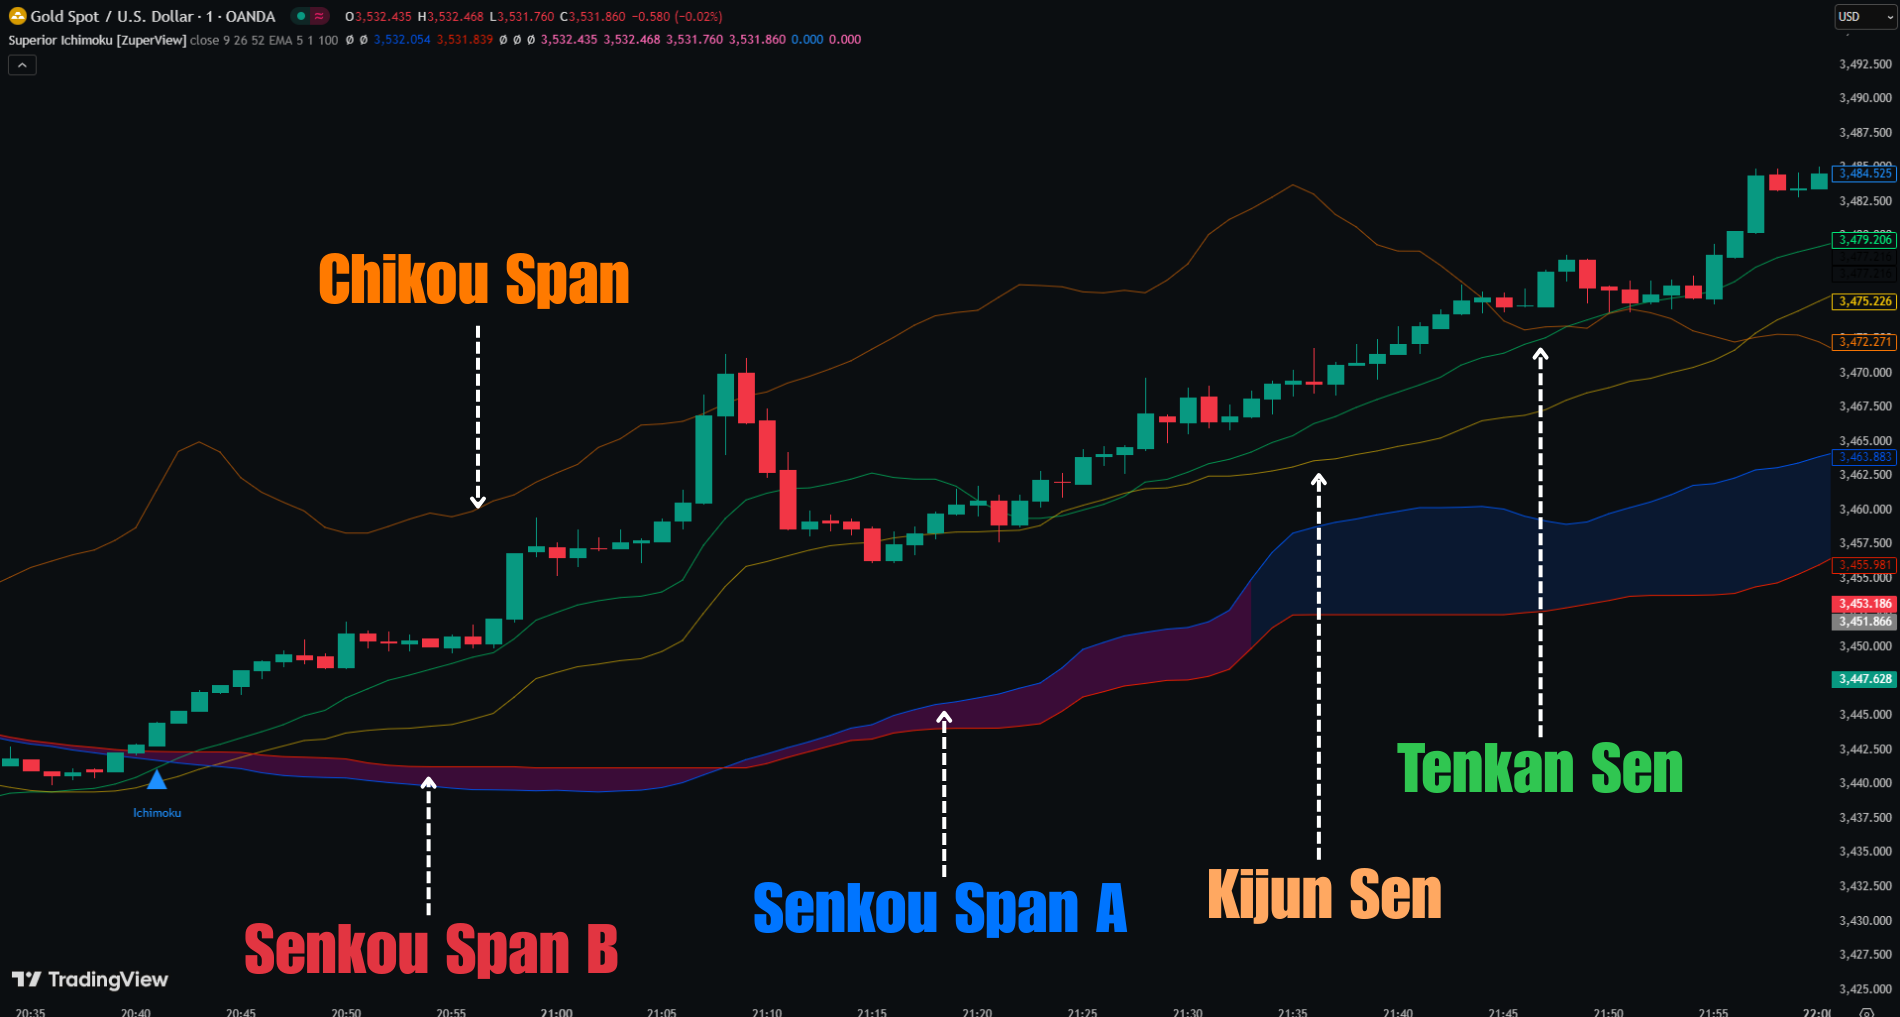
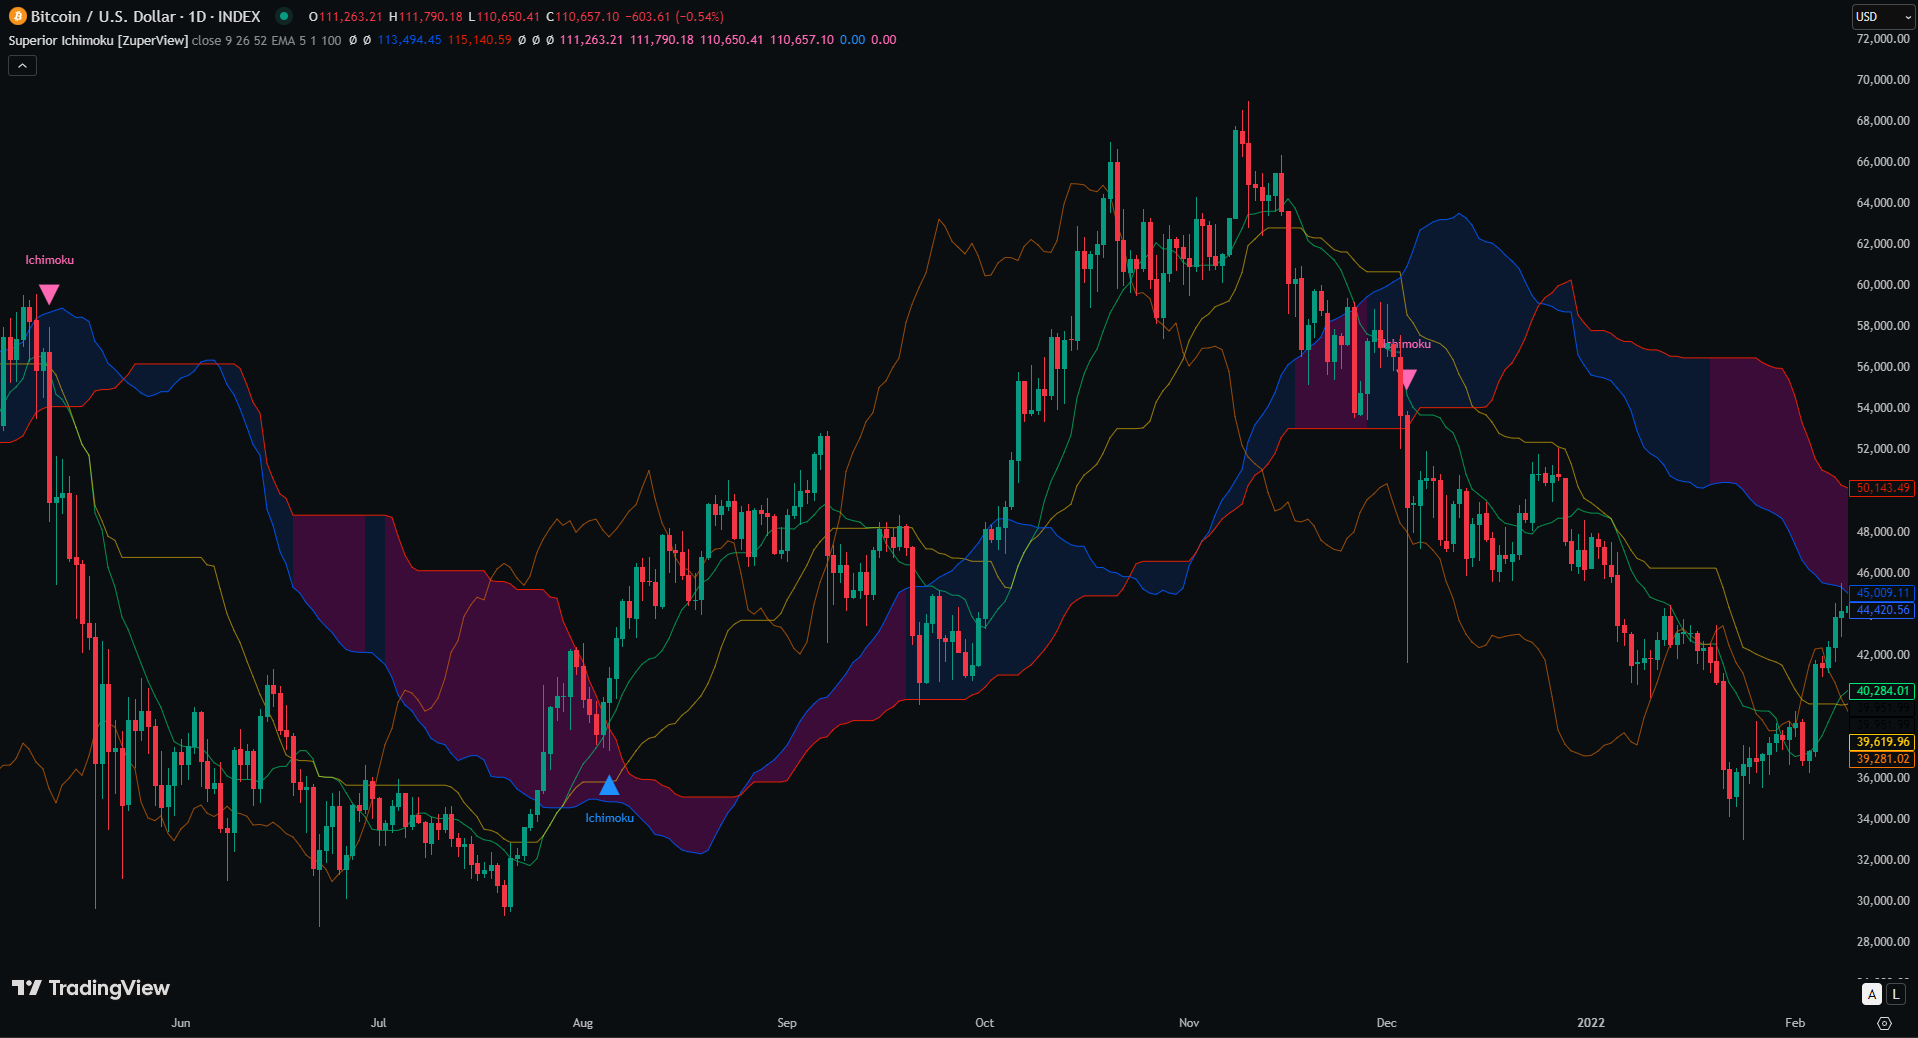
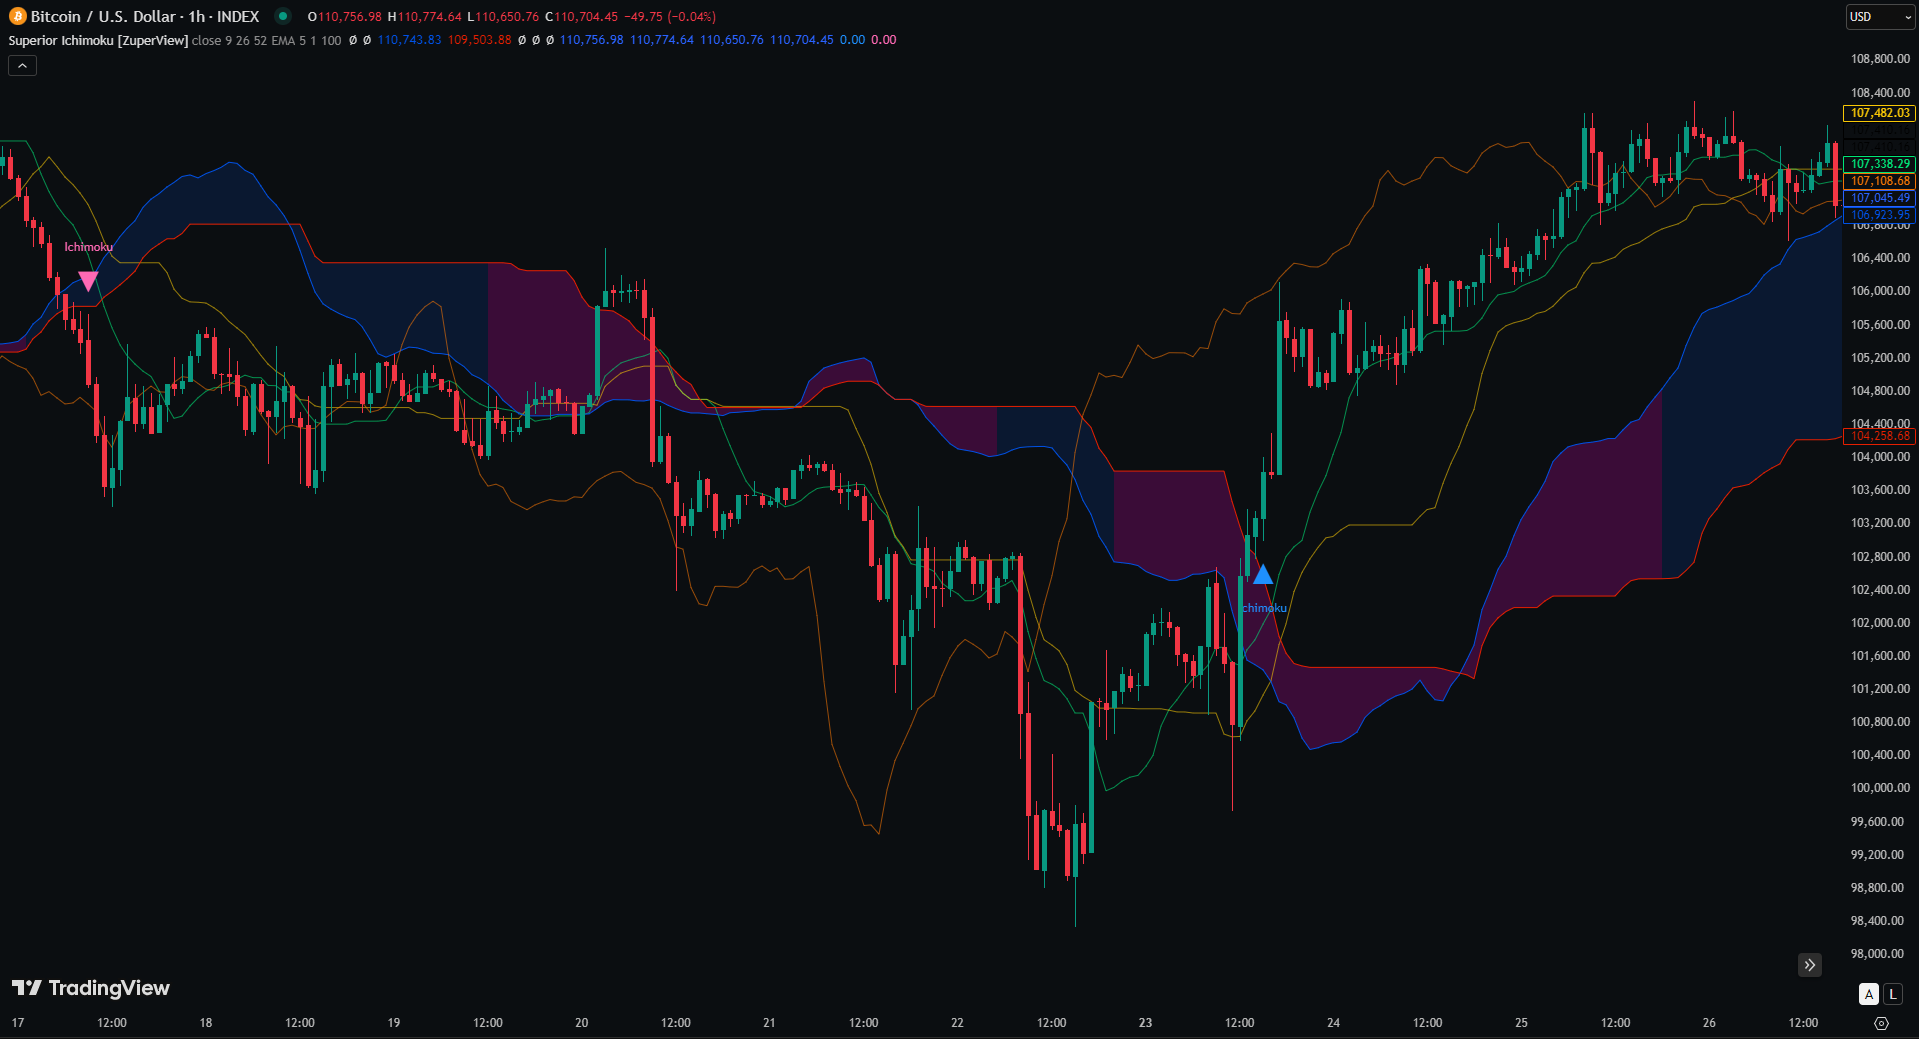
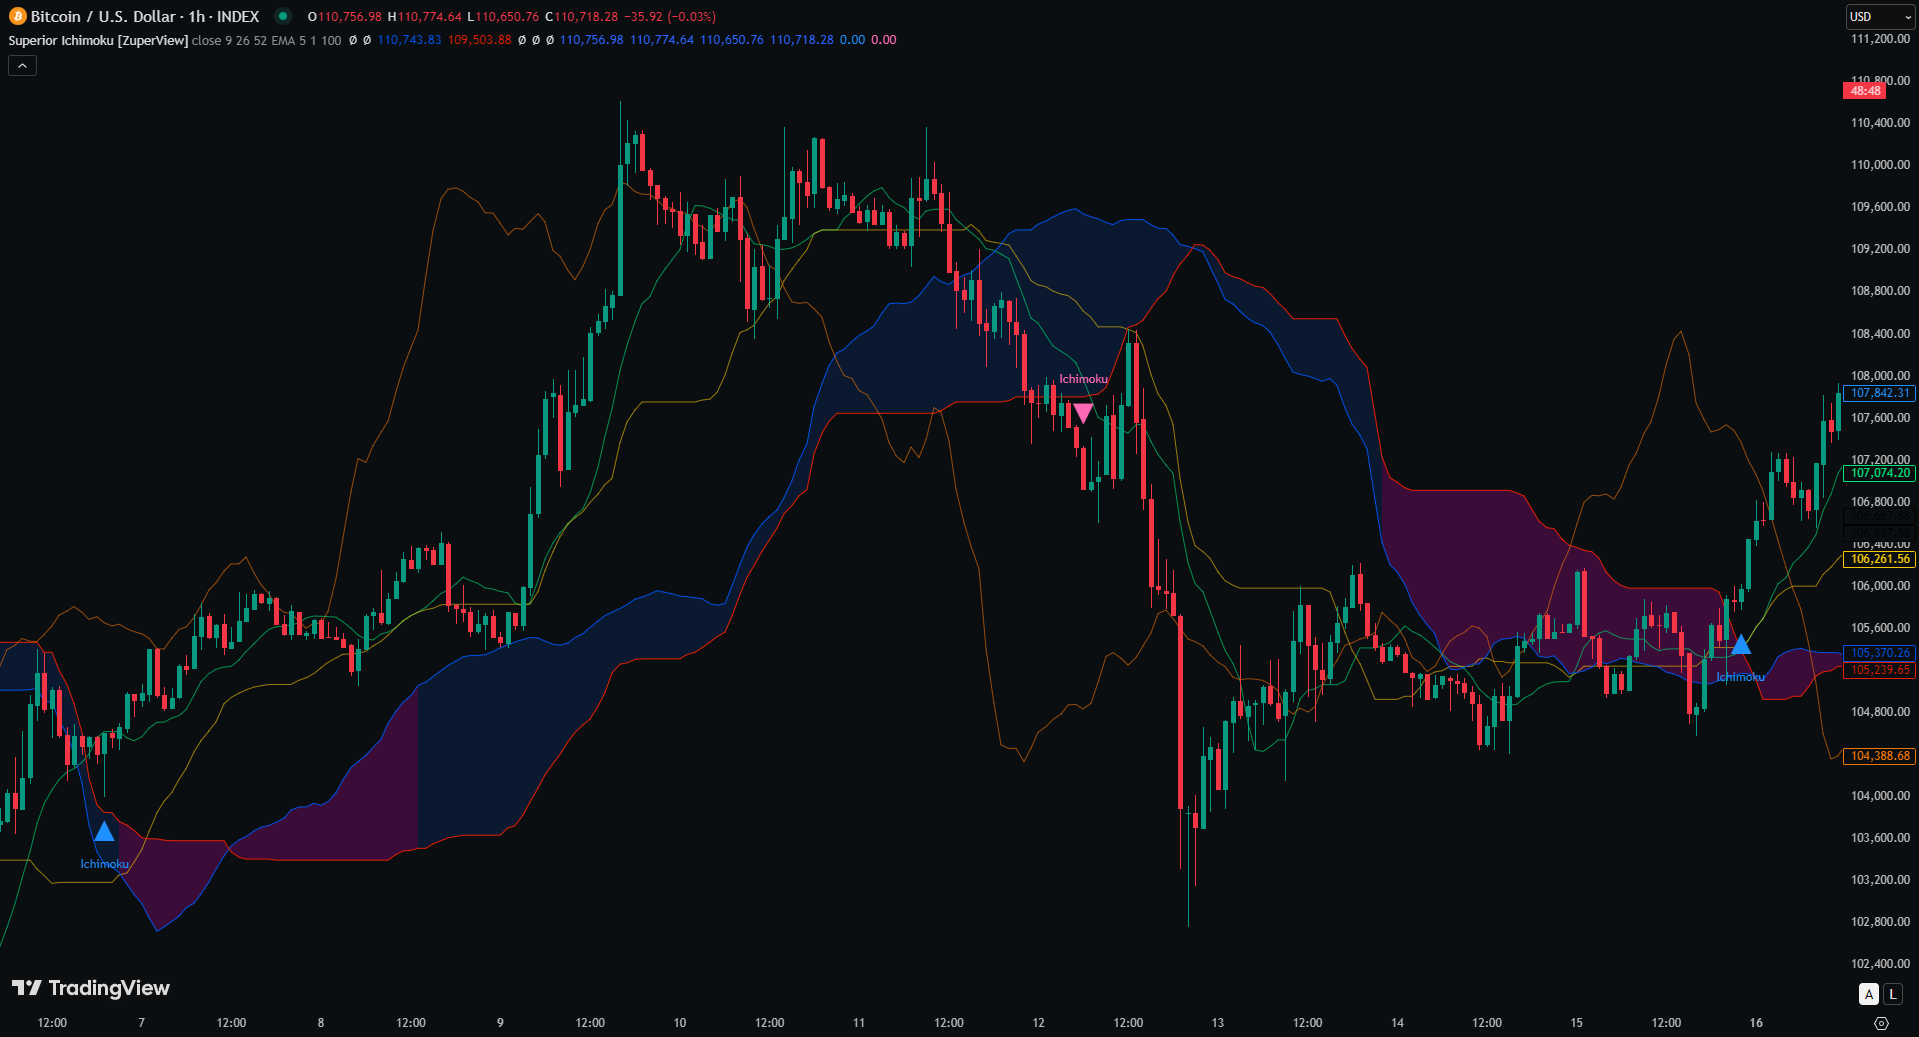
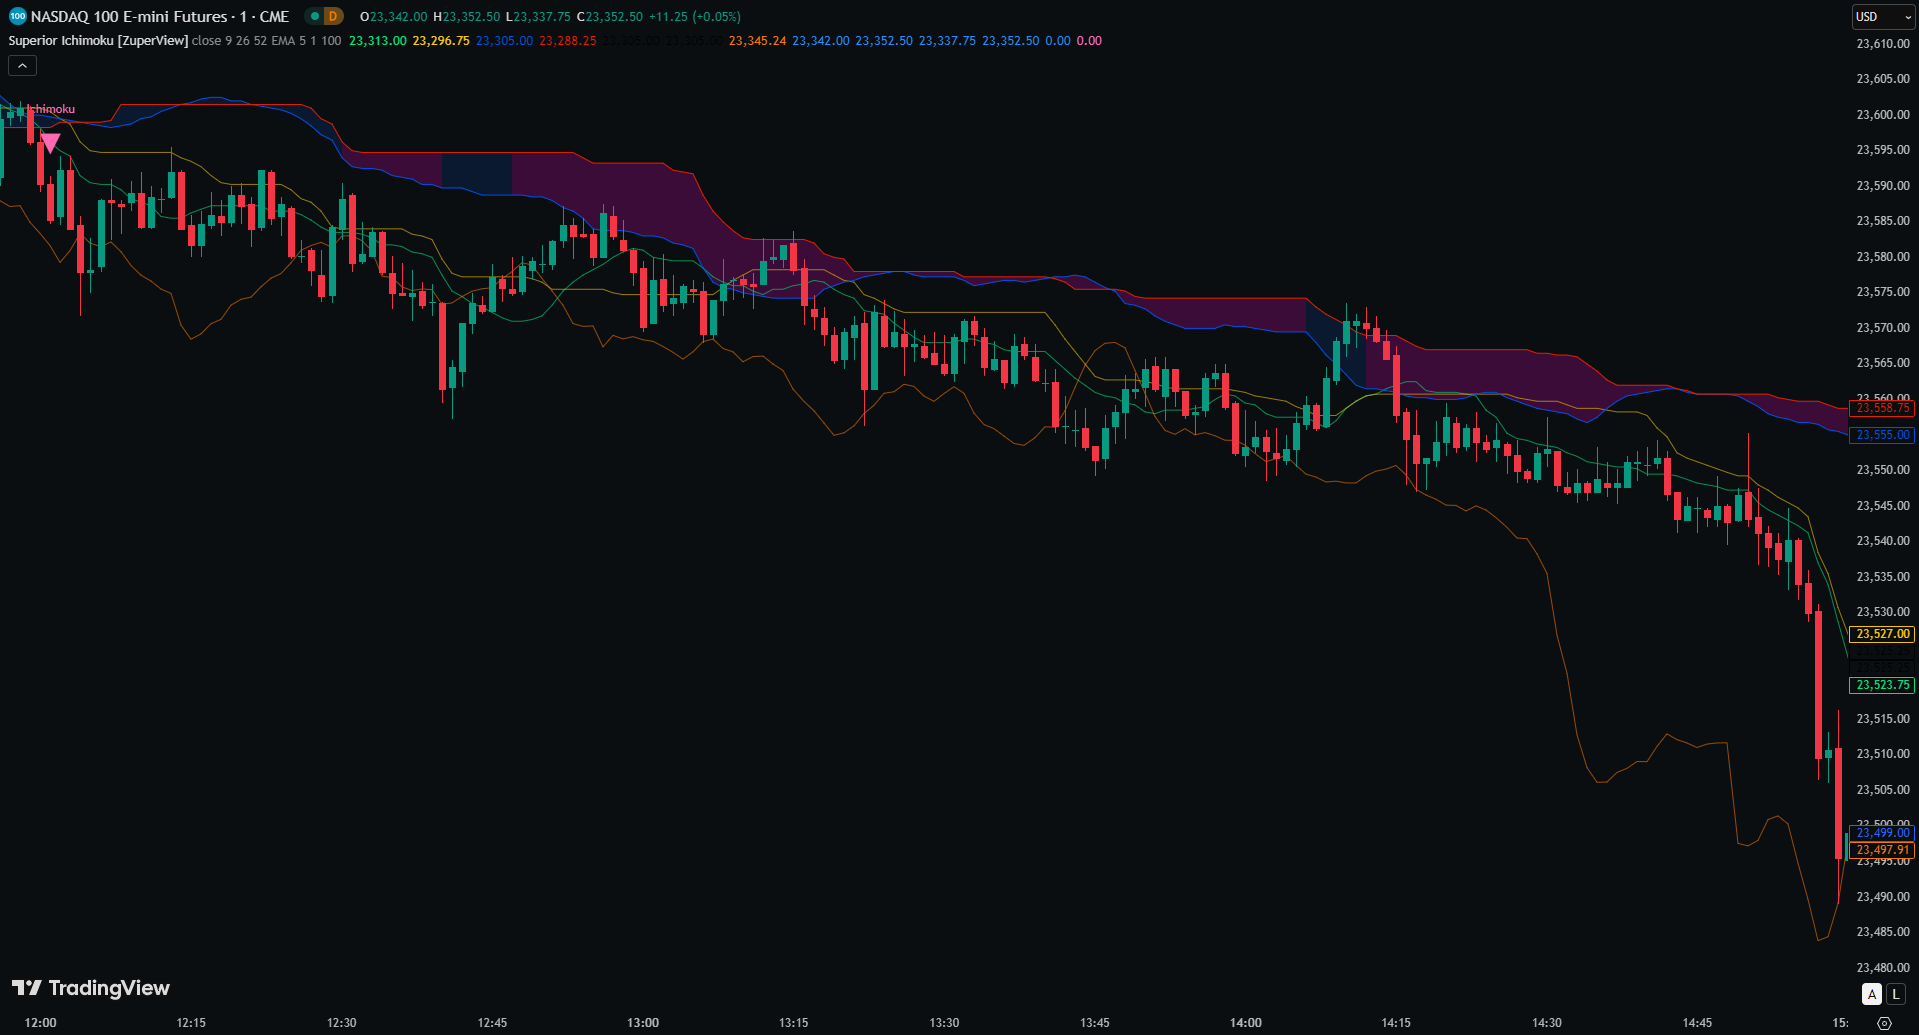
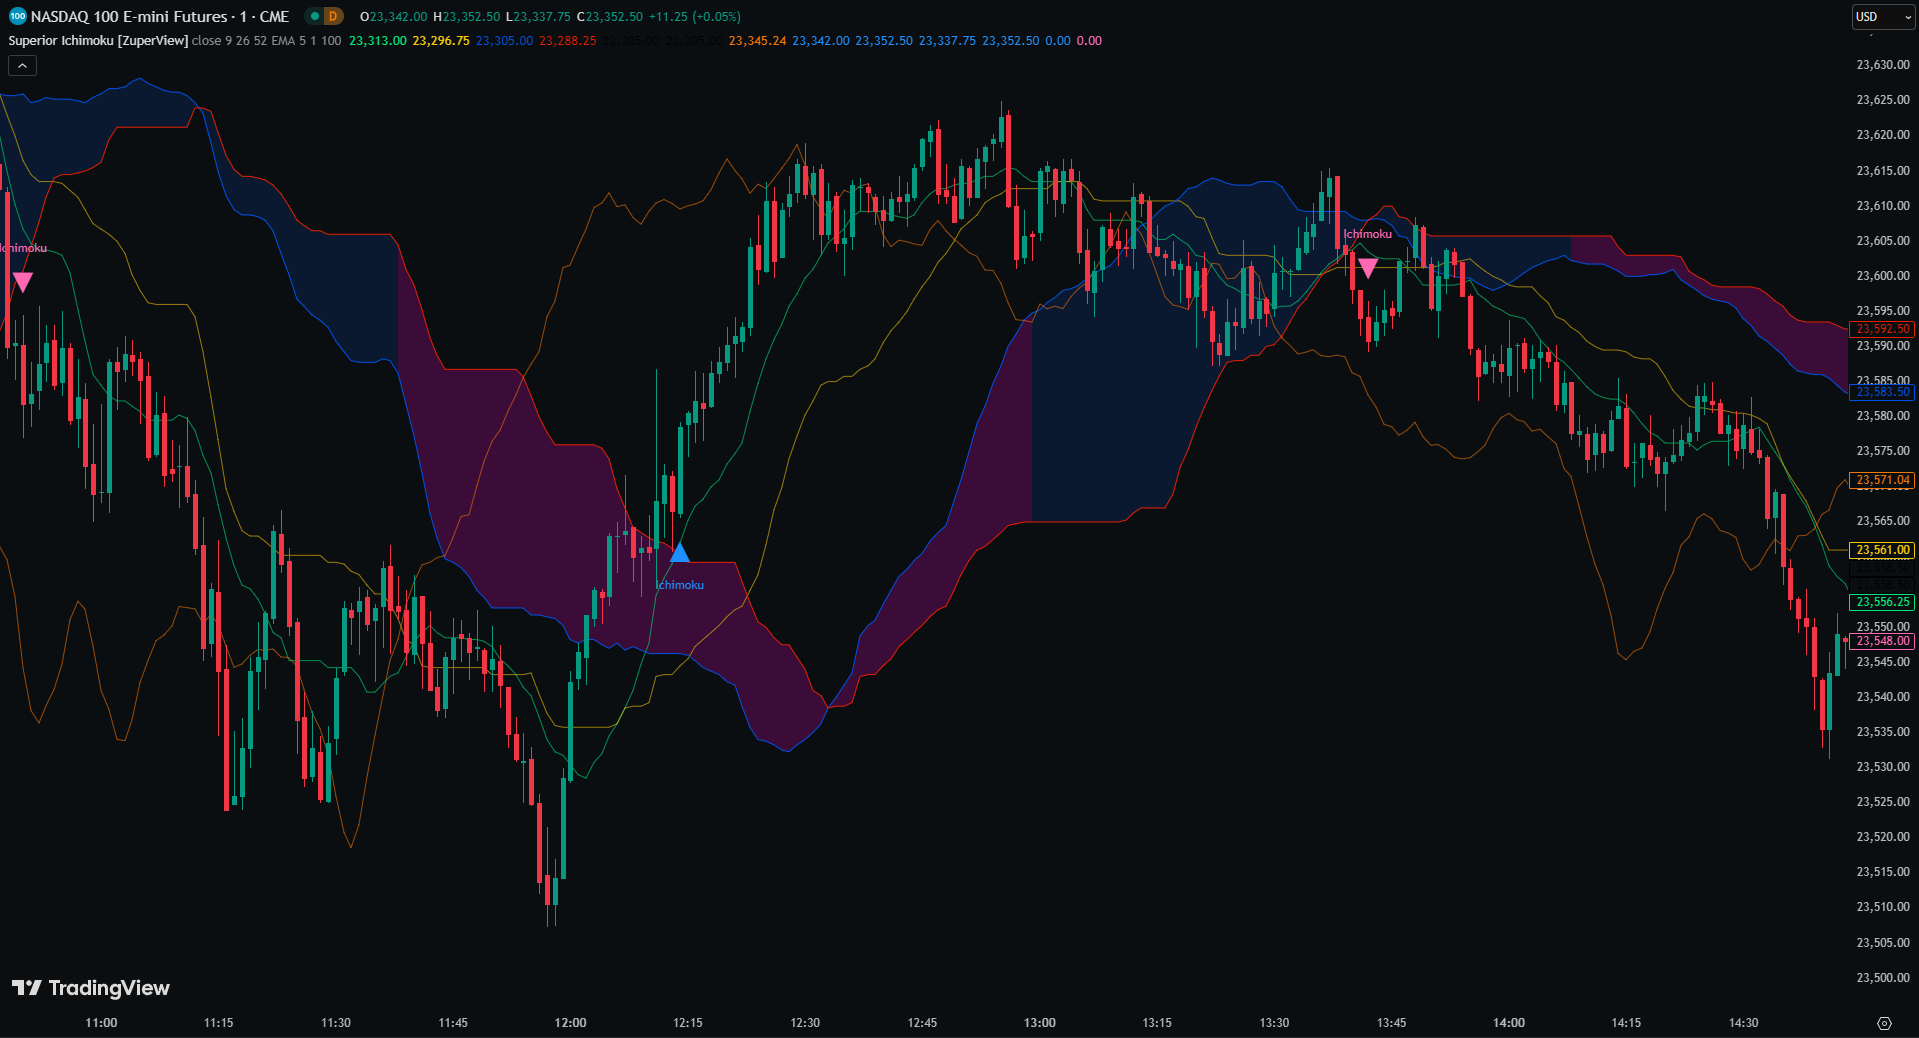
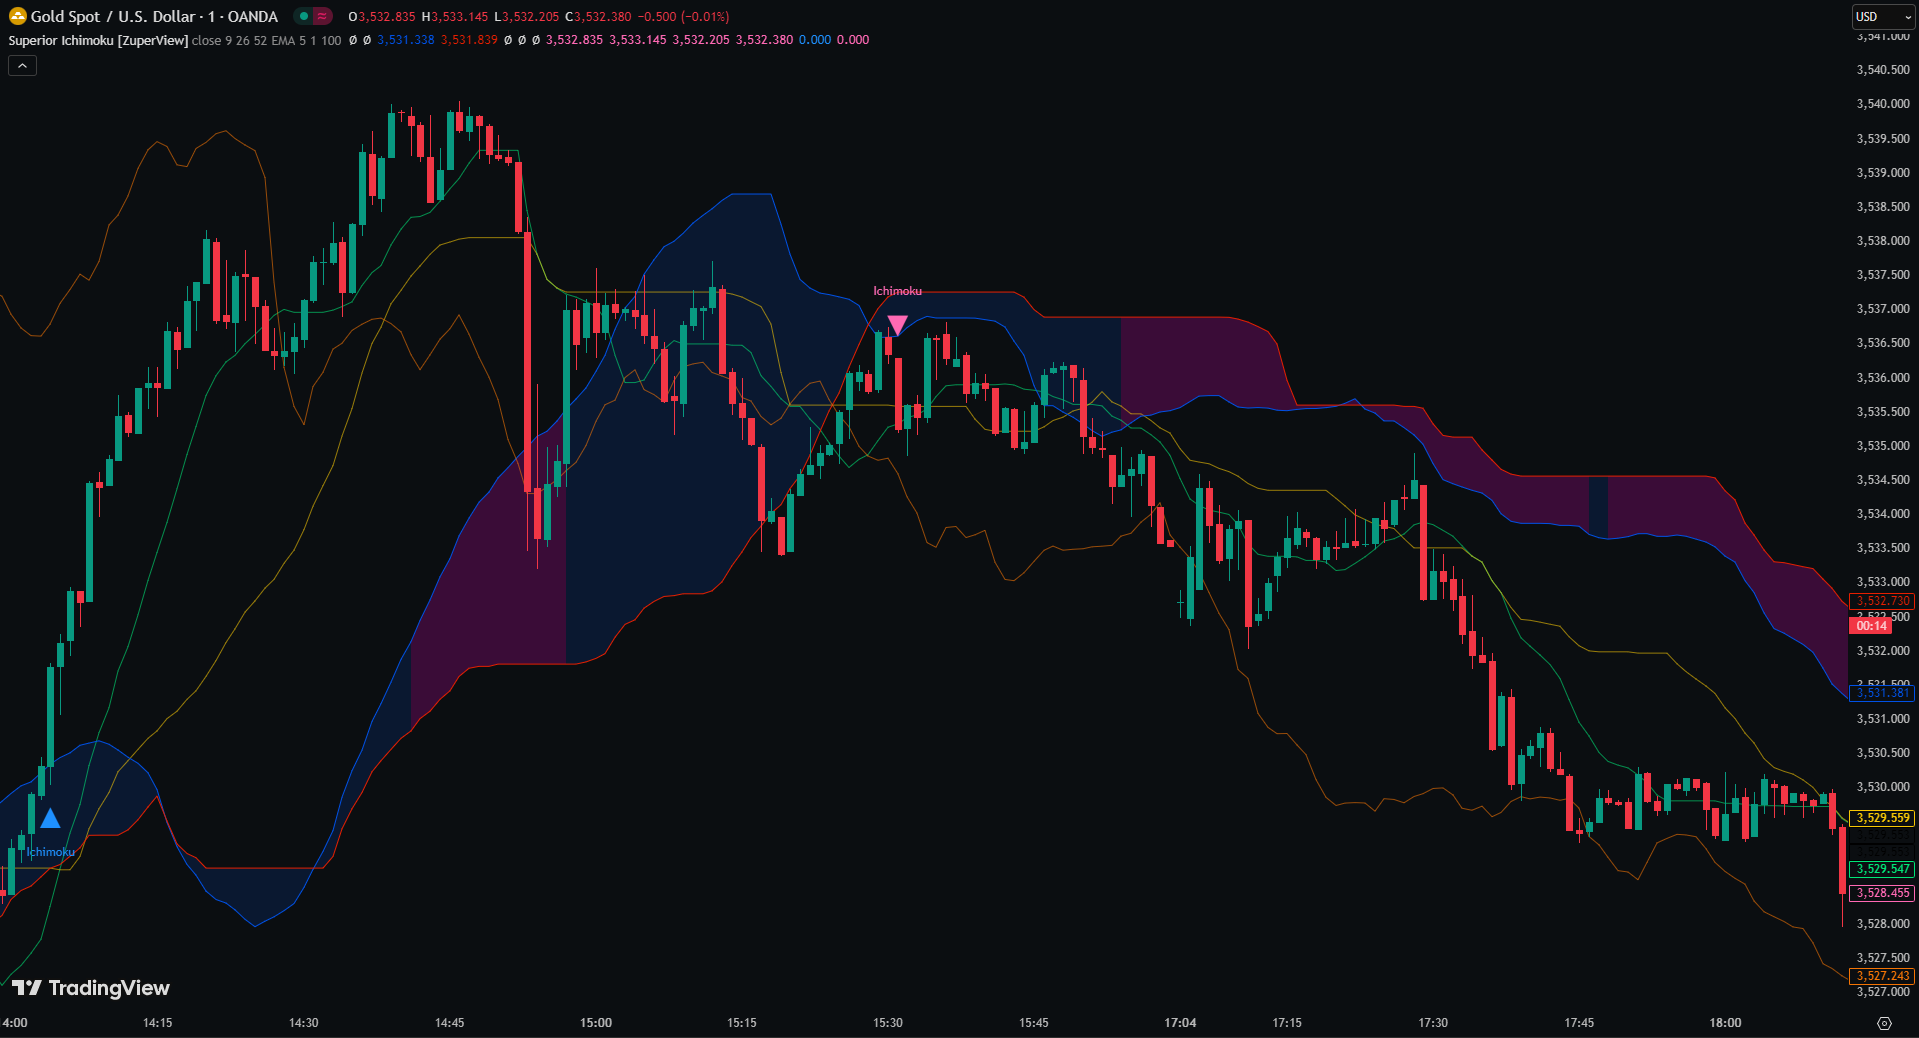
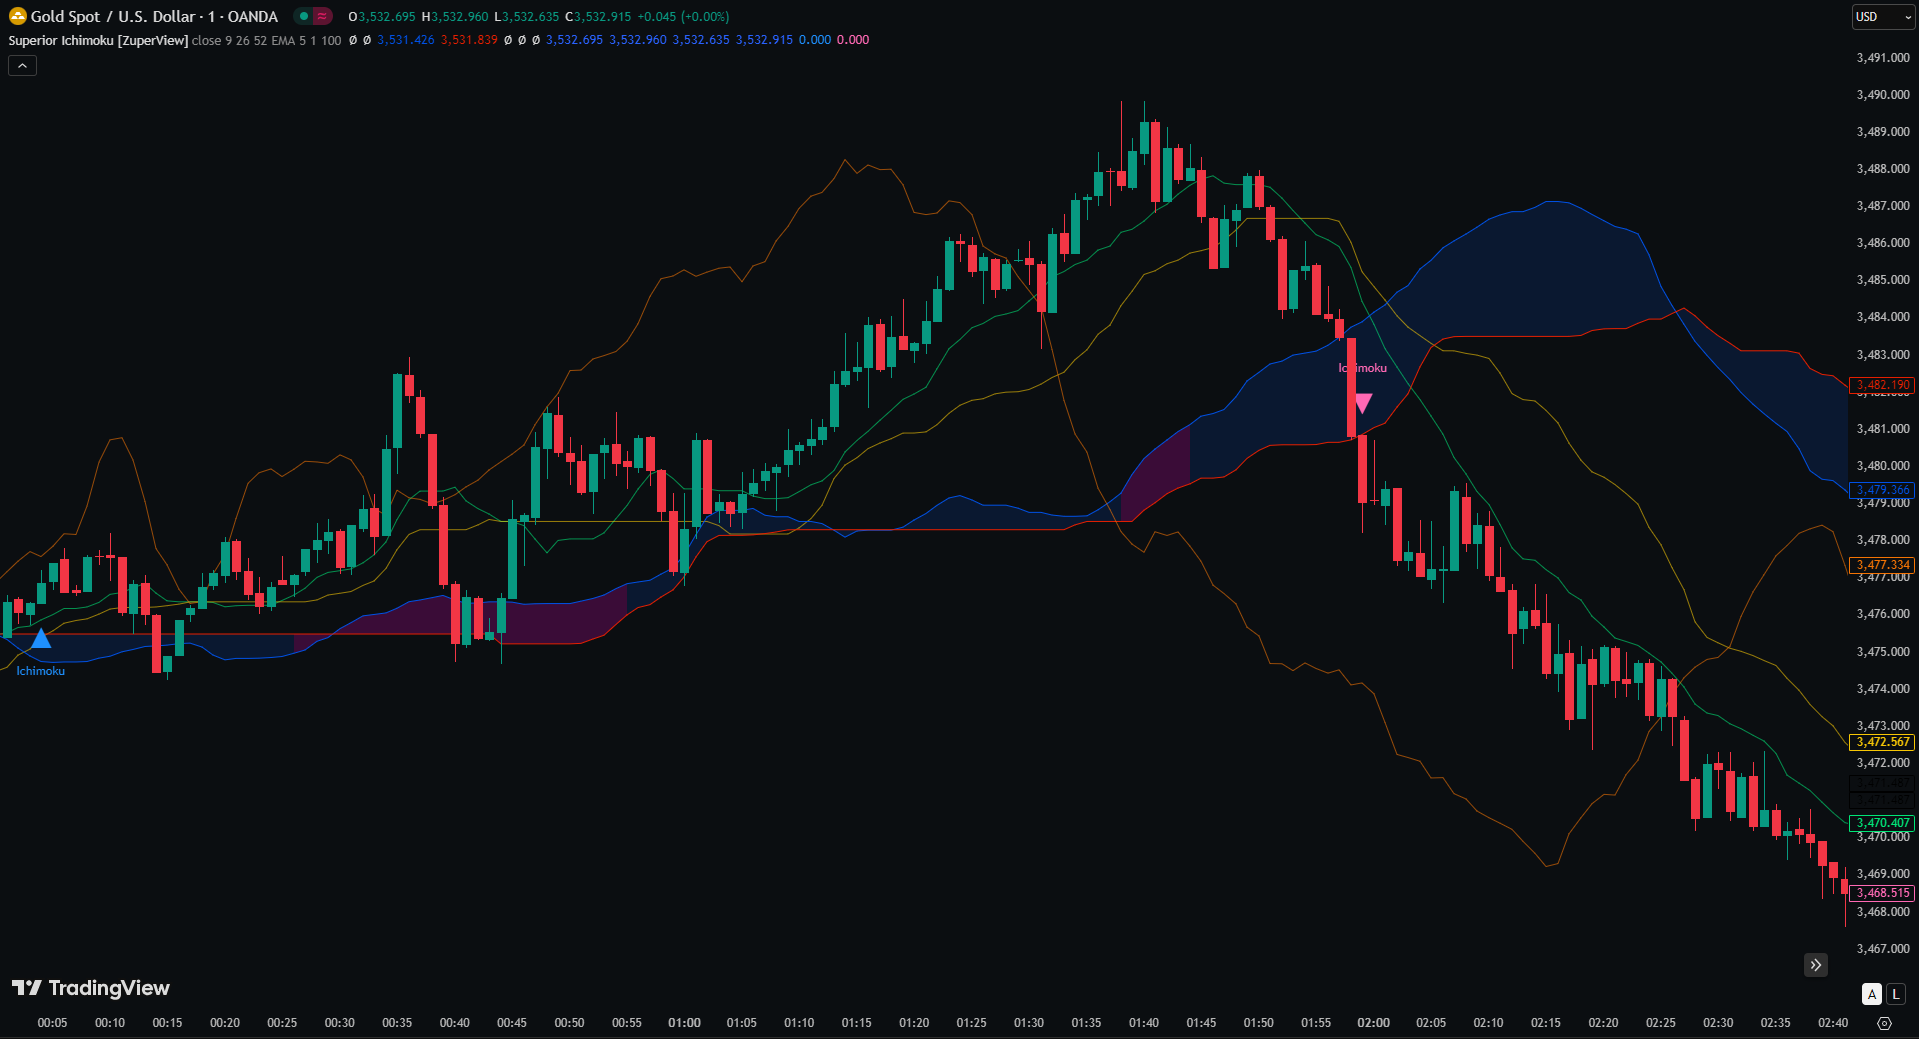
6. Ichimoku Cloud
Ichimoku Cloud is a complete trend-following system that shows trend direction, momentum, and dynamic support/resistance in one view. It uses five elements: the Kumo (cloud), Tenkan-sen, Kijun-sen, Chikou Span, and Senkou Span.
- Uptrend: Price above the cloud with a Tenkan–Kijun bullish cross.
- Downtrend: Price below the cloud with a bearish cross.
- Neutral: Price inside the cloud, often signaling consolidation.

Because it combines multiple signals into one framework, Ichimoku helps you assess market structure without relying on many separate indicators.
7. Parabolic SAR
Parabolic SAR is a classic trend-following indicator designed to track price momentum and guide trade management. It plots dots above or below the price:
- Uptrend: Dots appear below price, signaling bullish conditions.
- Downtrend: Dots appear above price, signaling bearish momentum.

Traders often use Parabolic SAR to define entry/exit signals or to trail stop-loss levels as a trend develops. It performs best in trending markets, but can produce false signals in choppy or sideways conditions. For this reason, traders typically combine Parabolic SAR with a trend filter such as EMA or ADX to confirm the overall direction before taking trades.
Advanced & custom Pine Script indicators and systems
While popular indicators like Moving Averages or RSI provide reliable trend signals, custom TradingView indicators can help you gain clearer insights, reduce chart clutter, and capture more dependable entries.
Here are some of the effective advanced tools for trend-following:
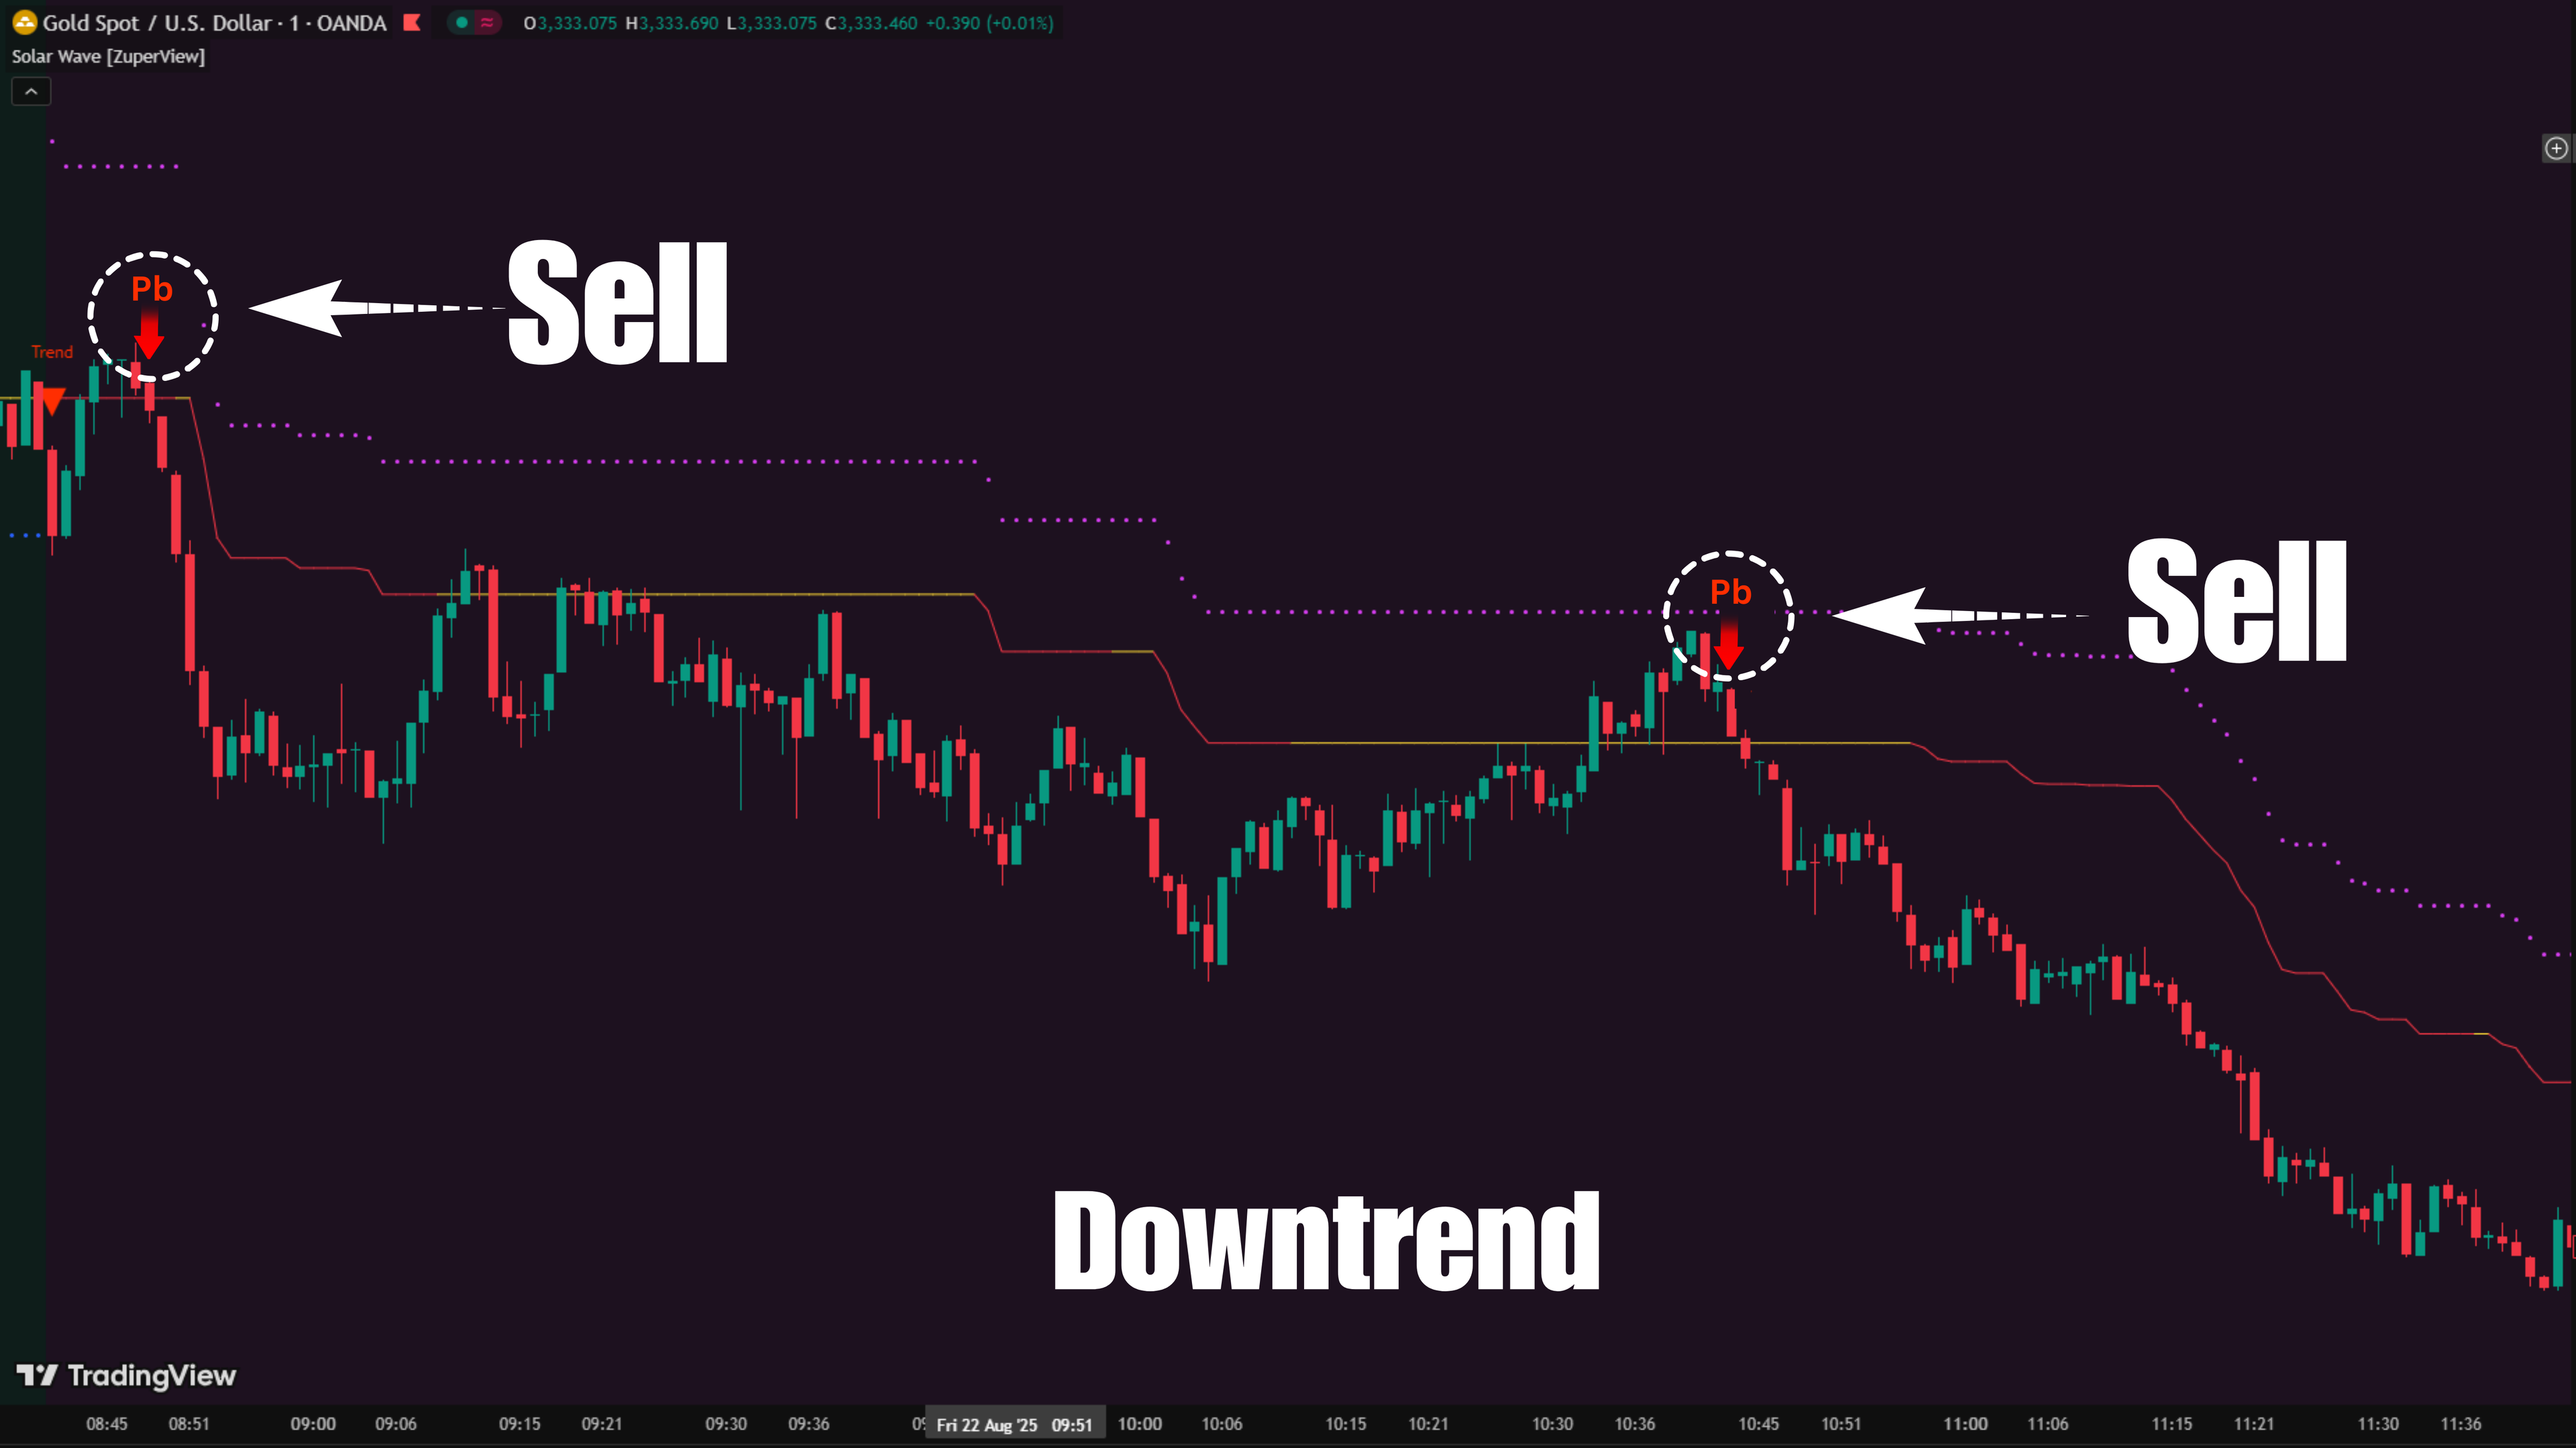
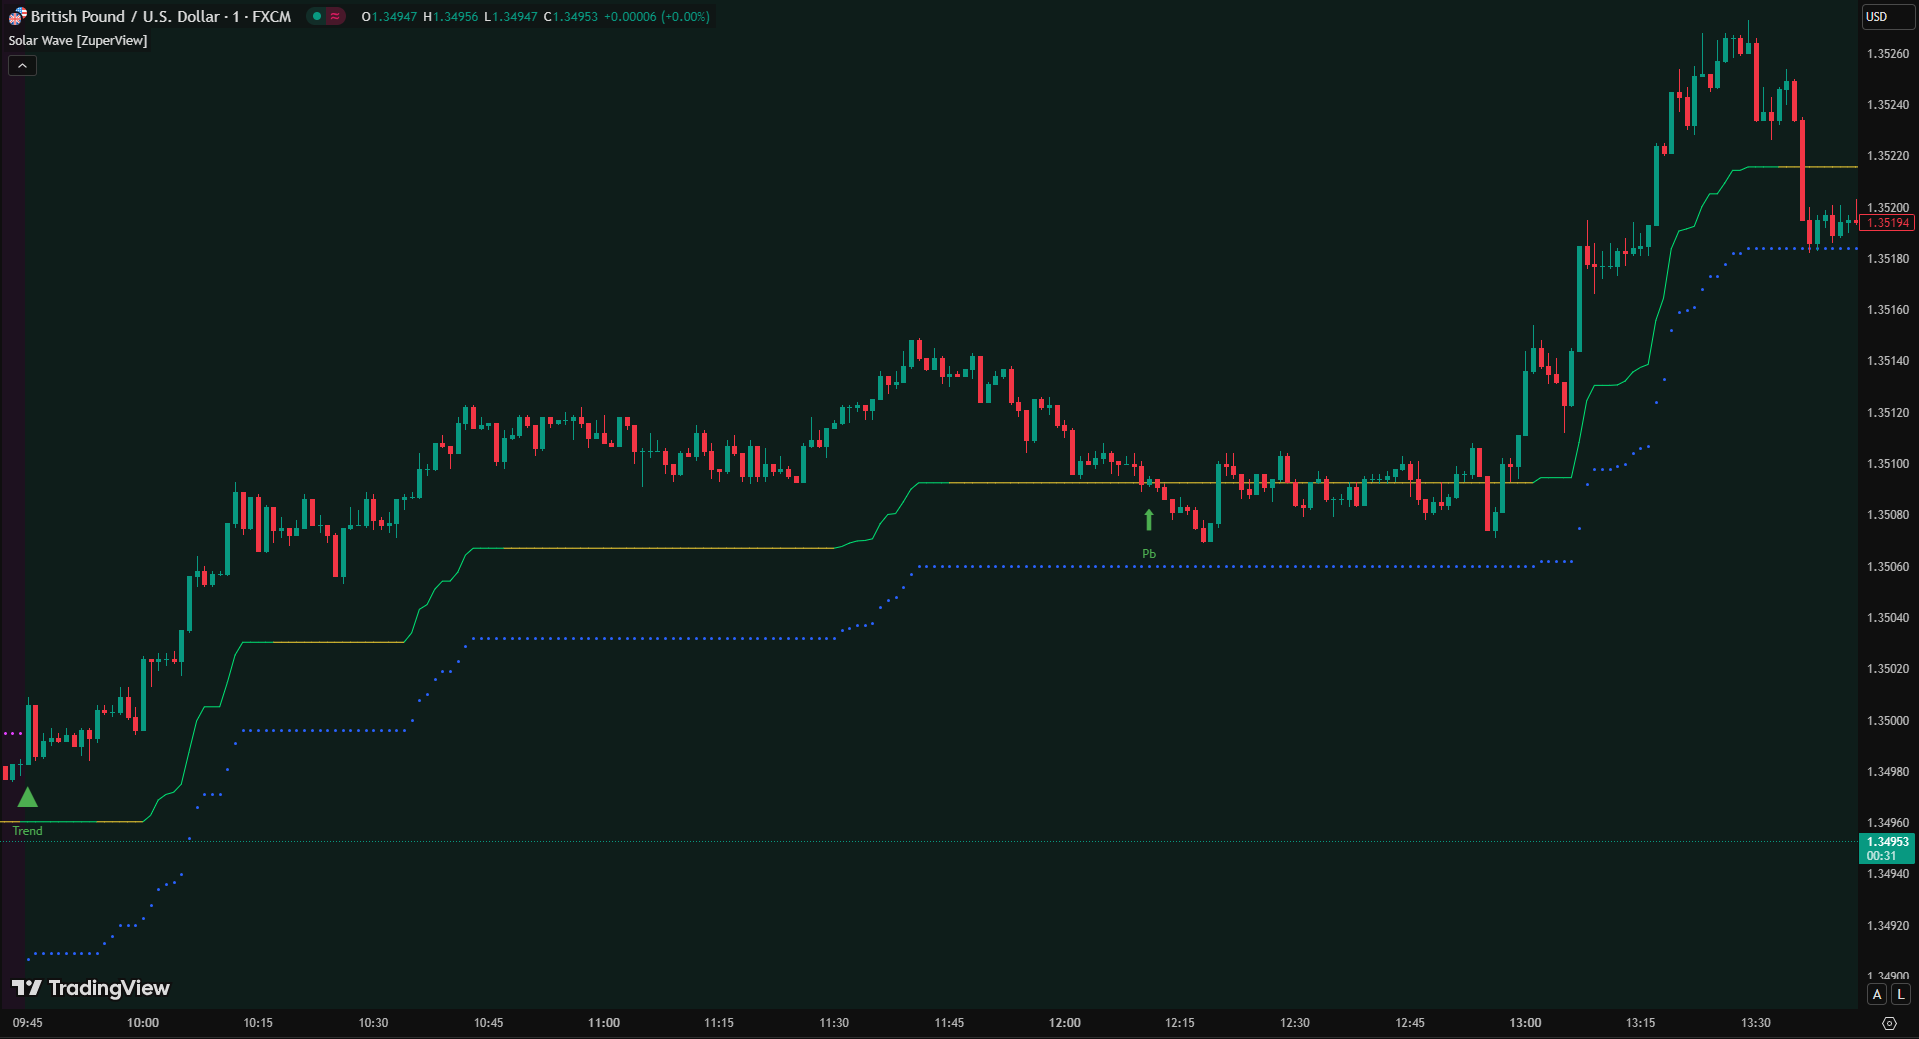
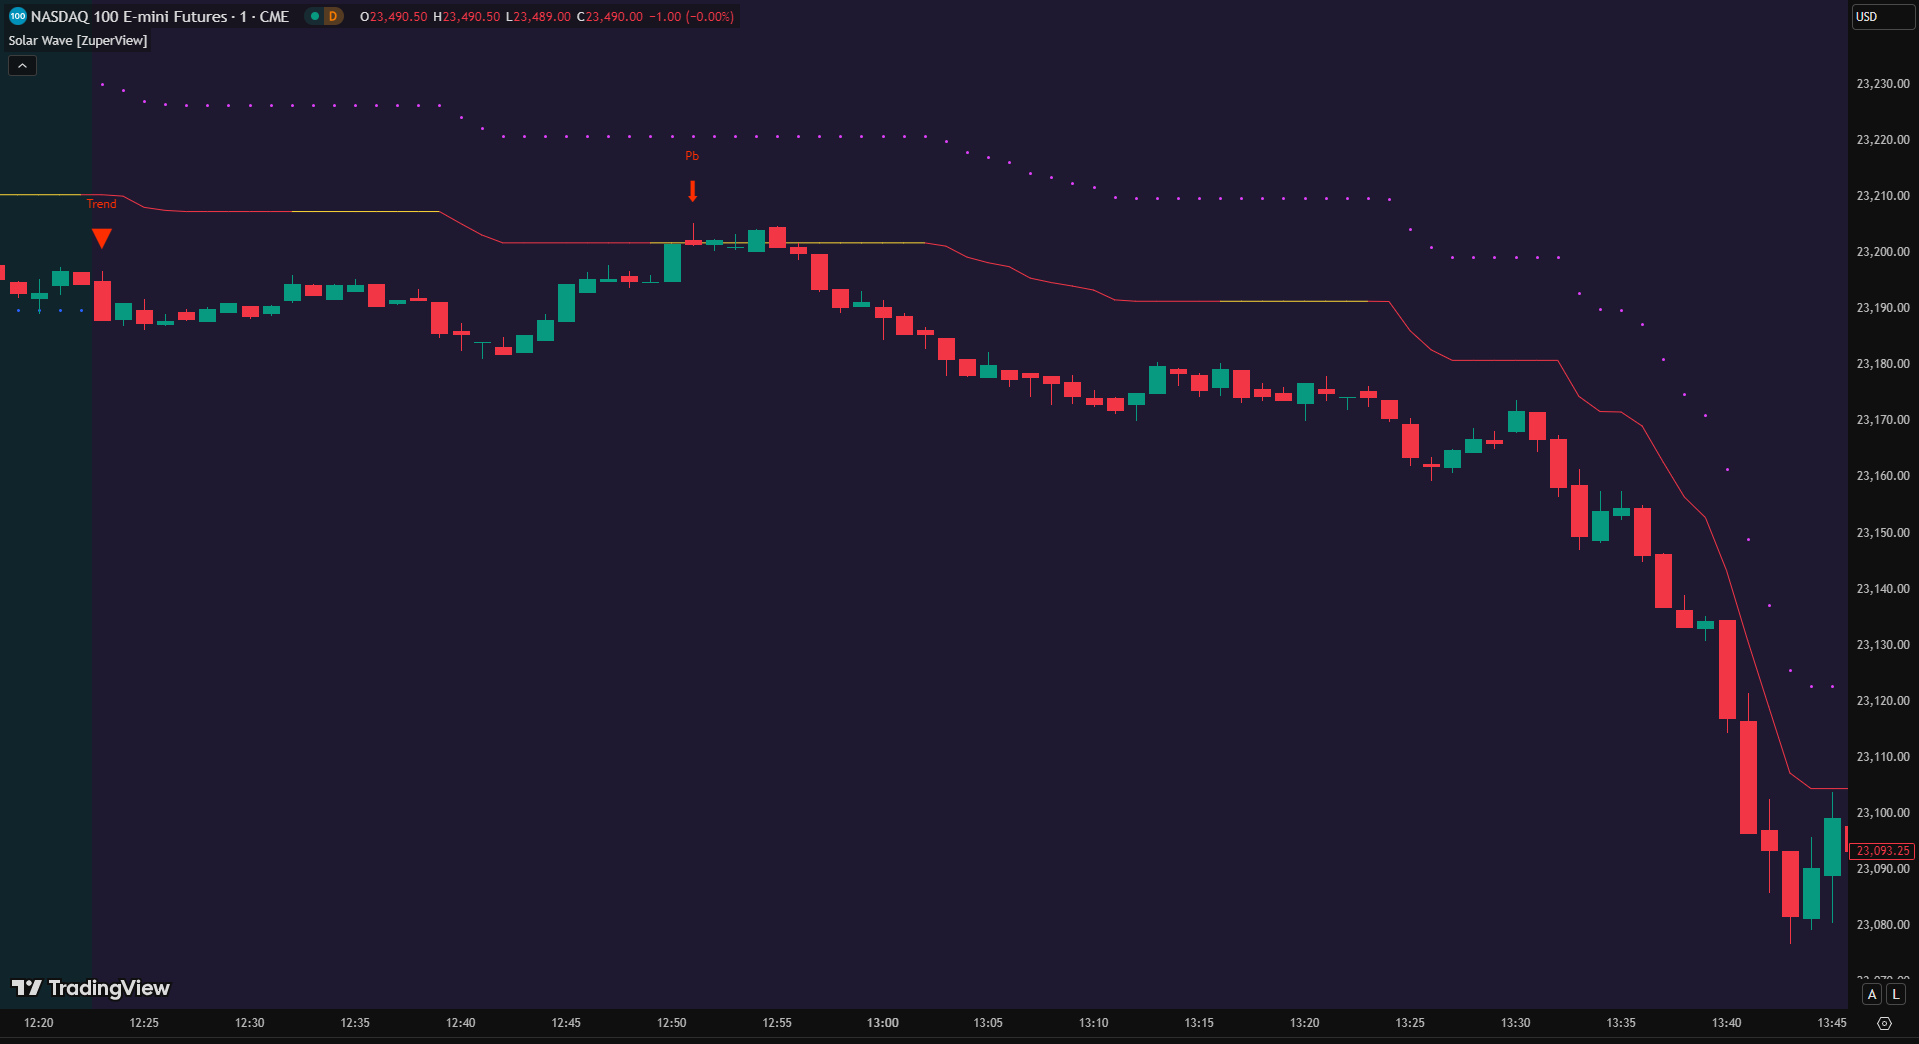
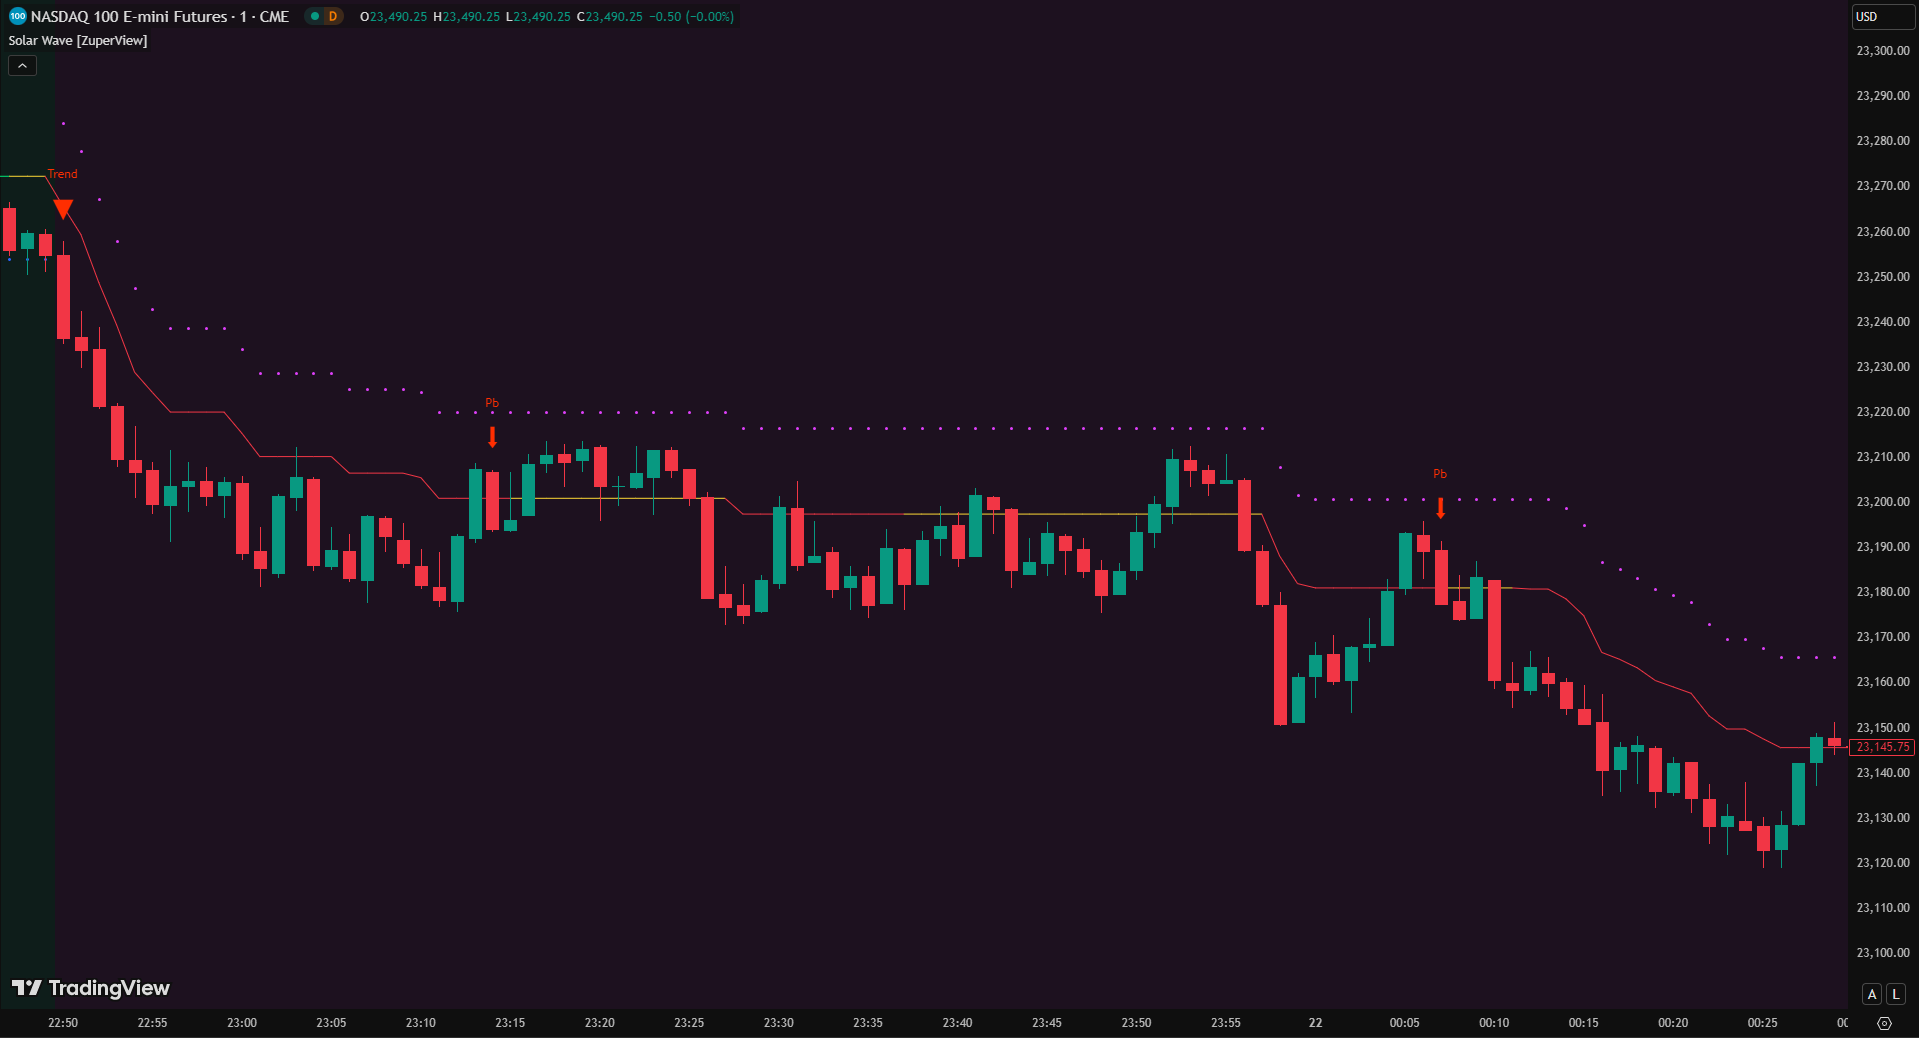
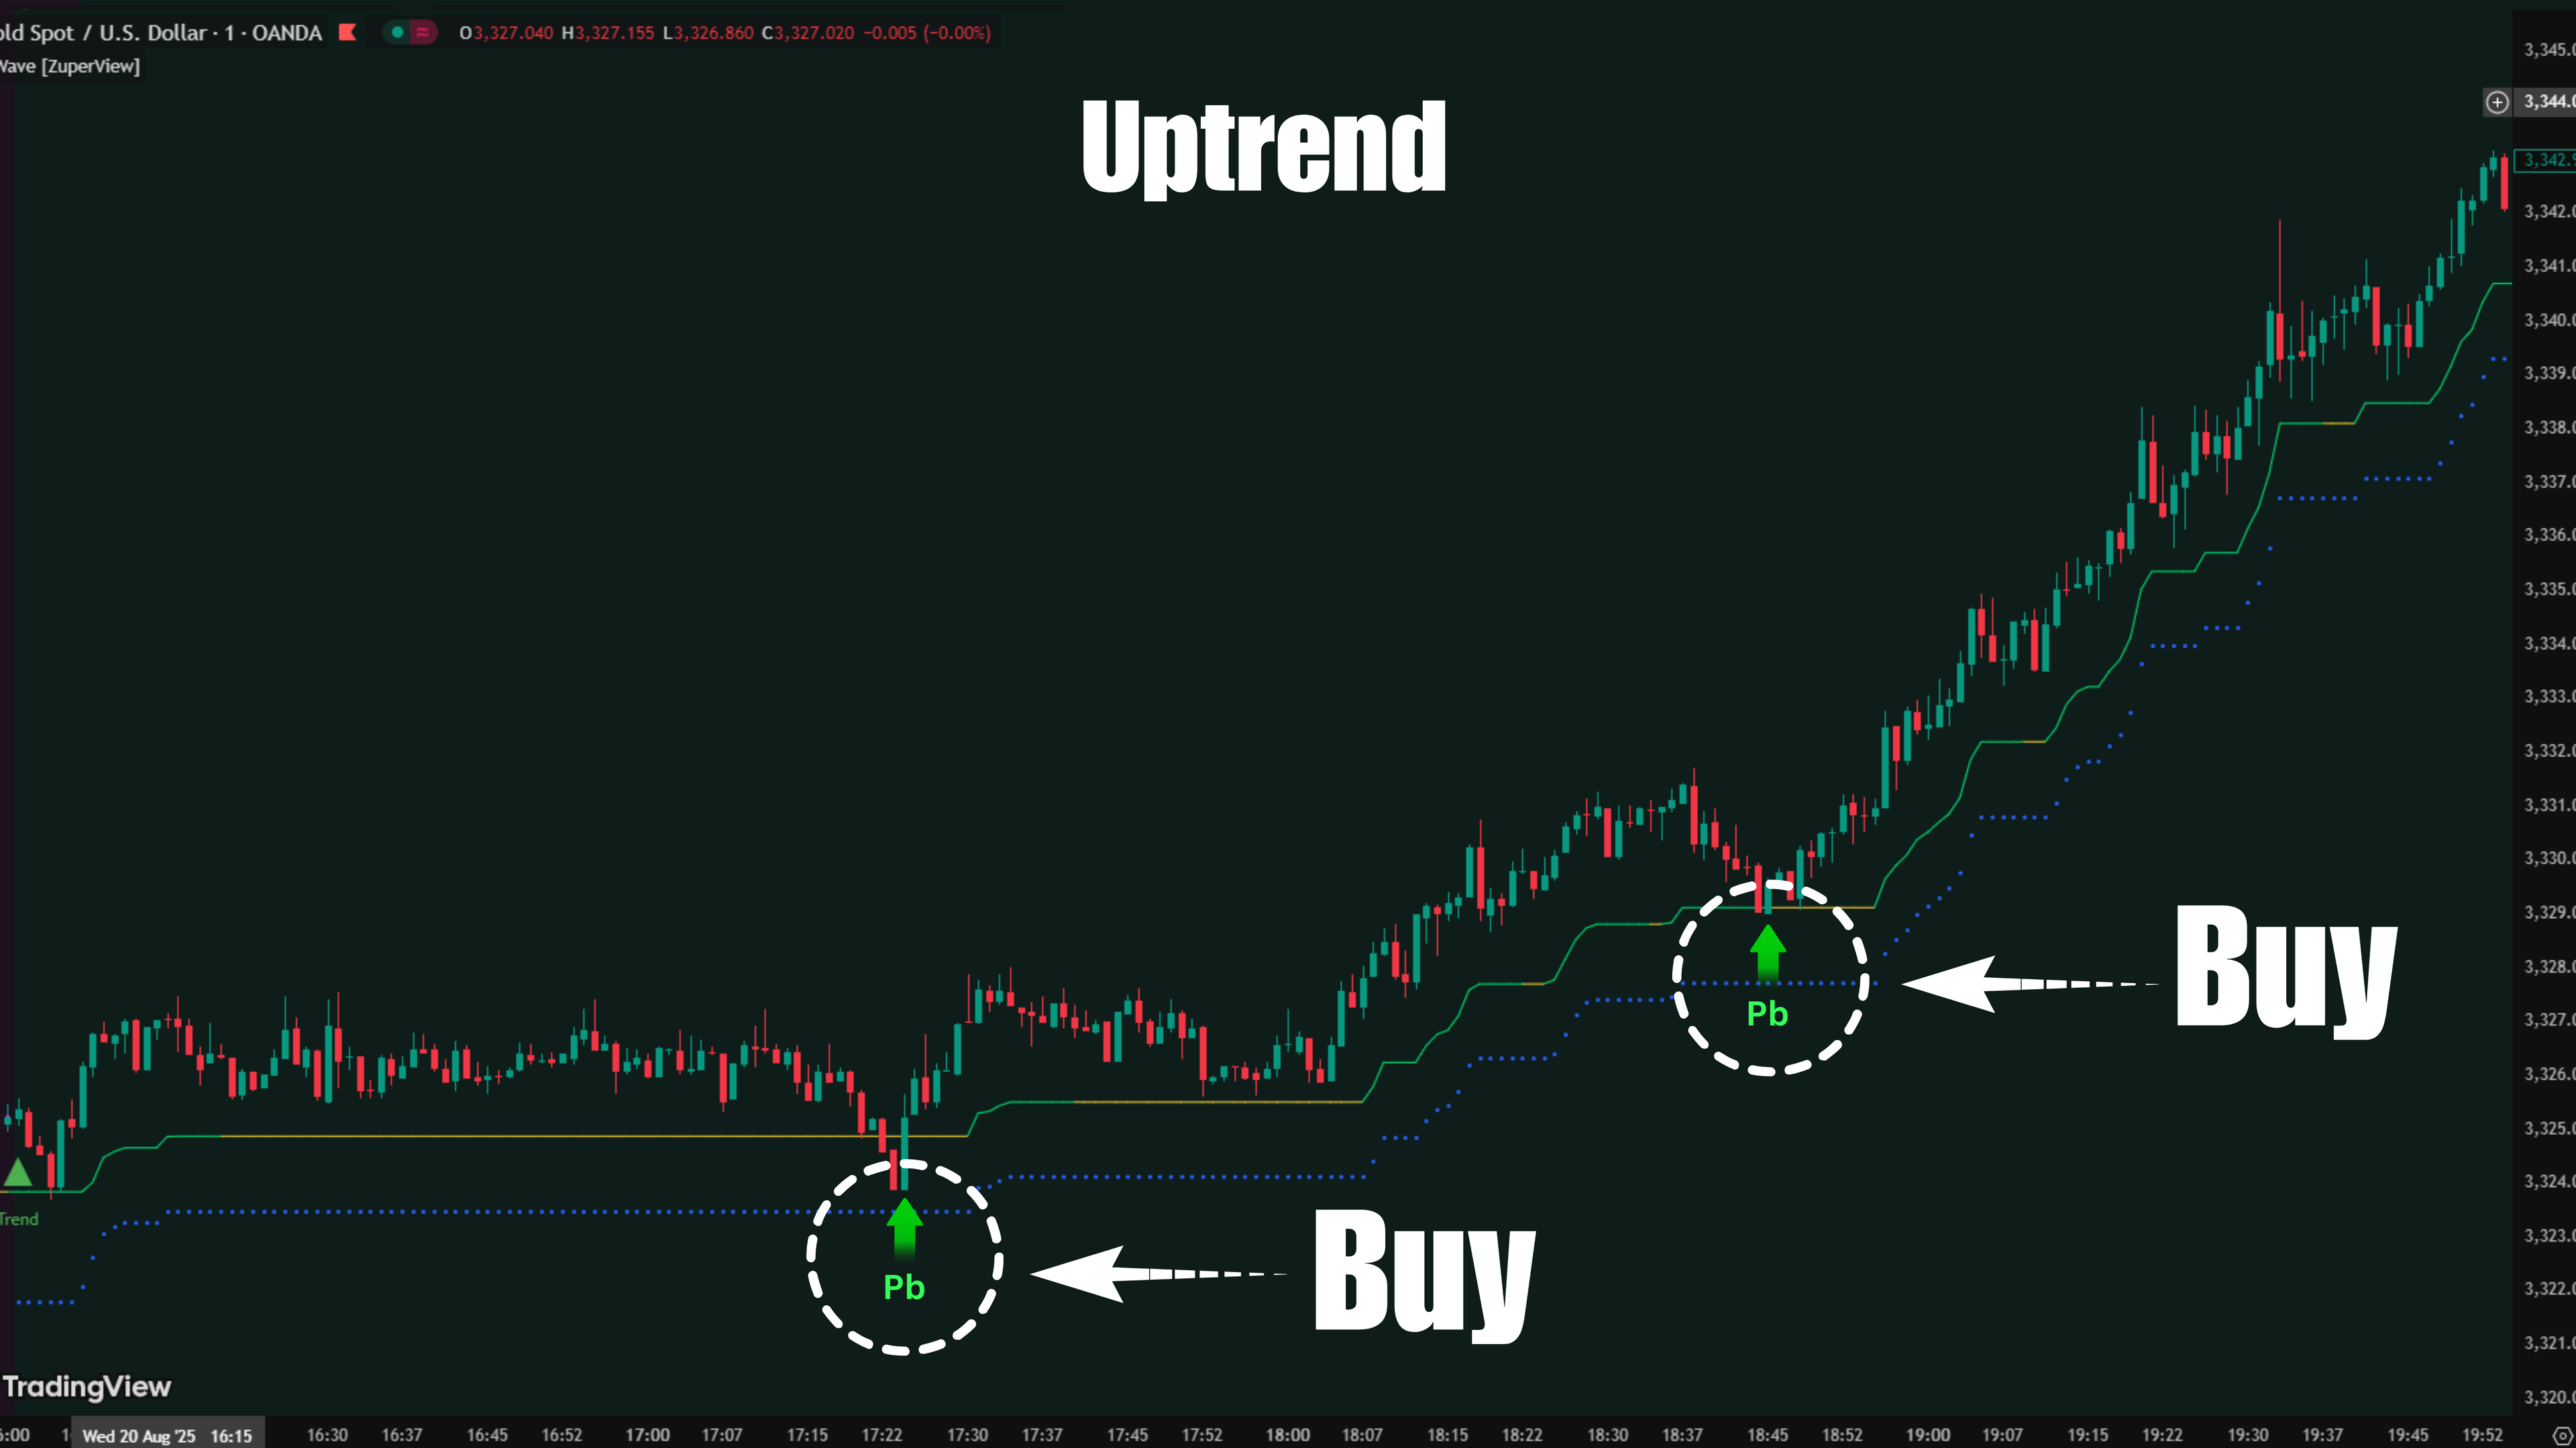
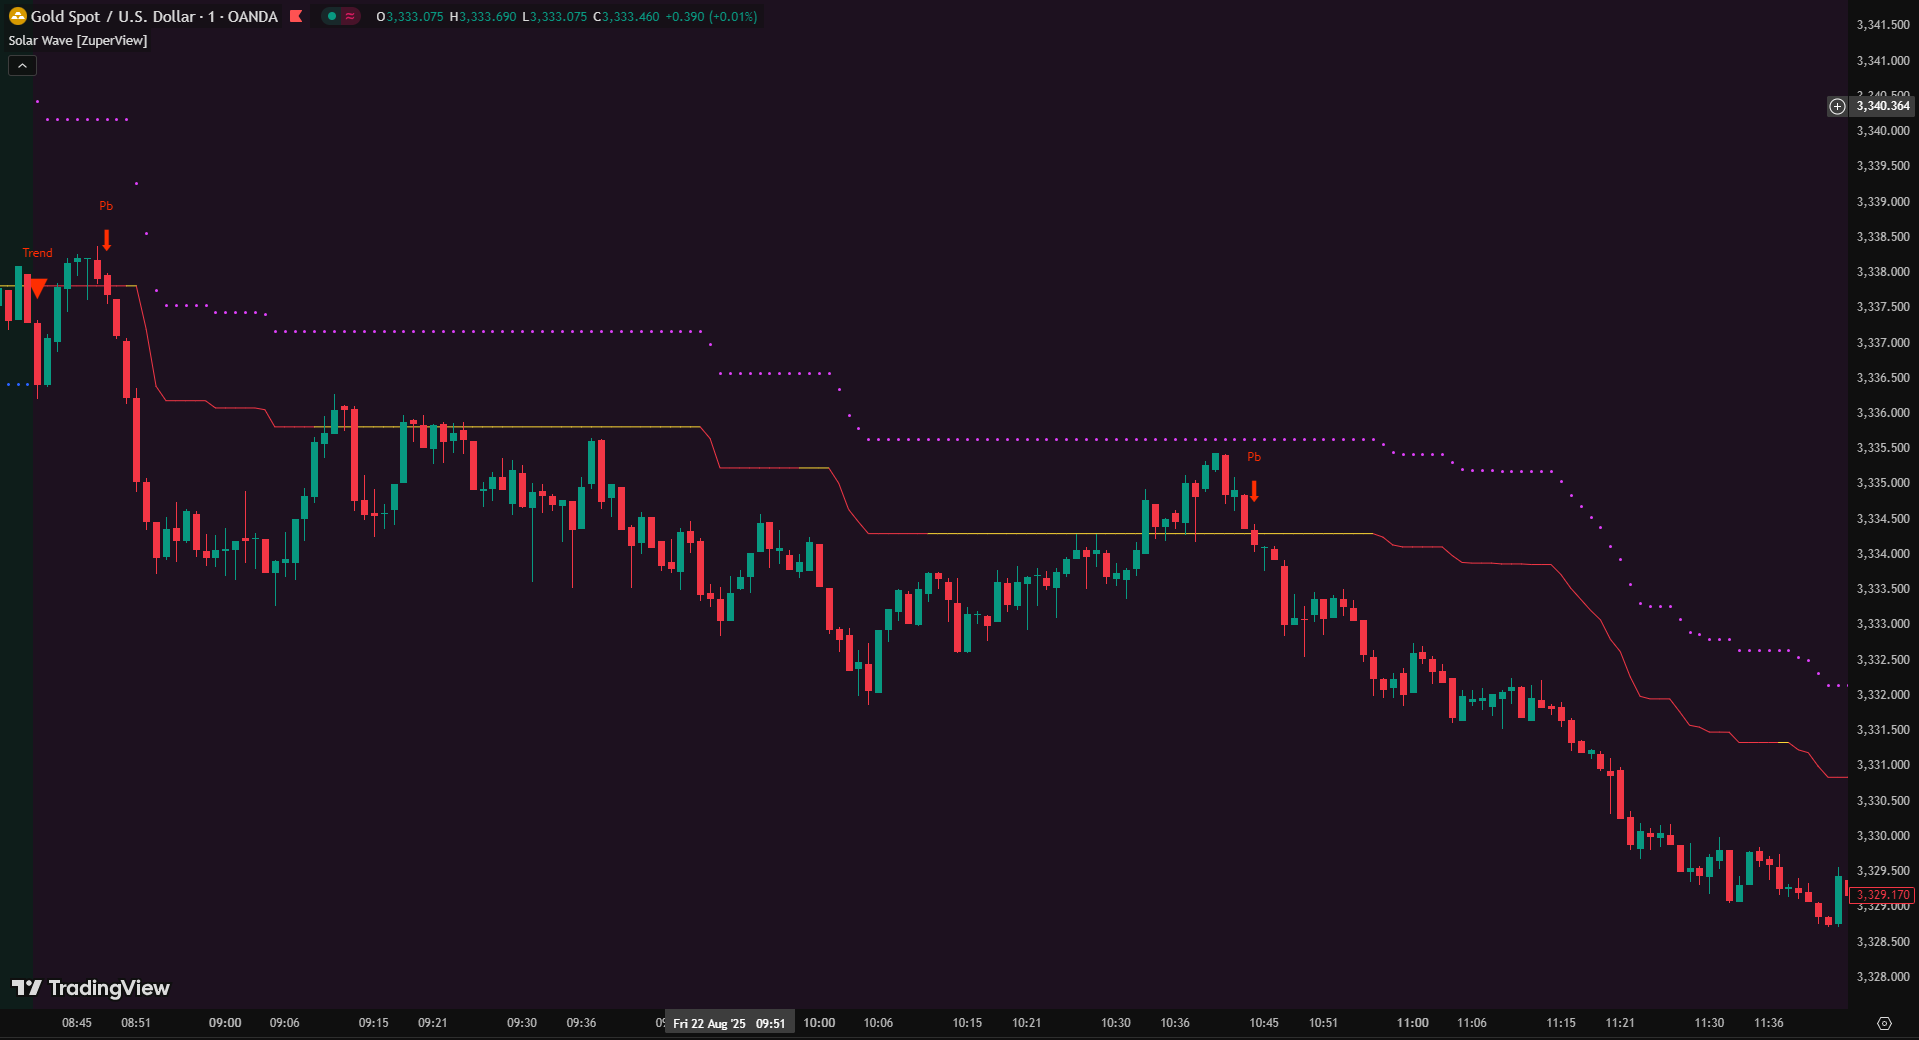
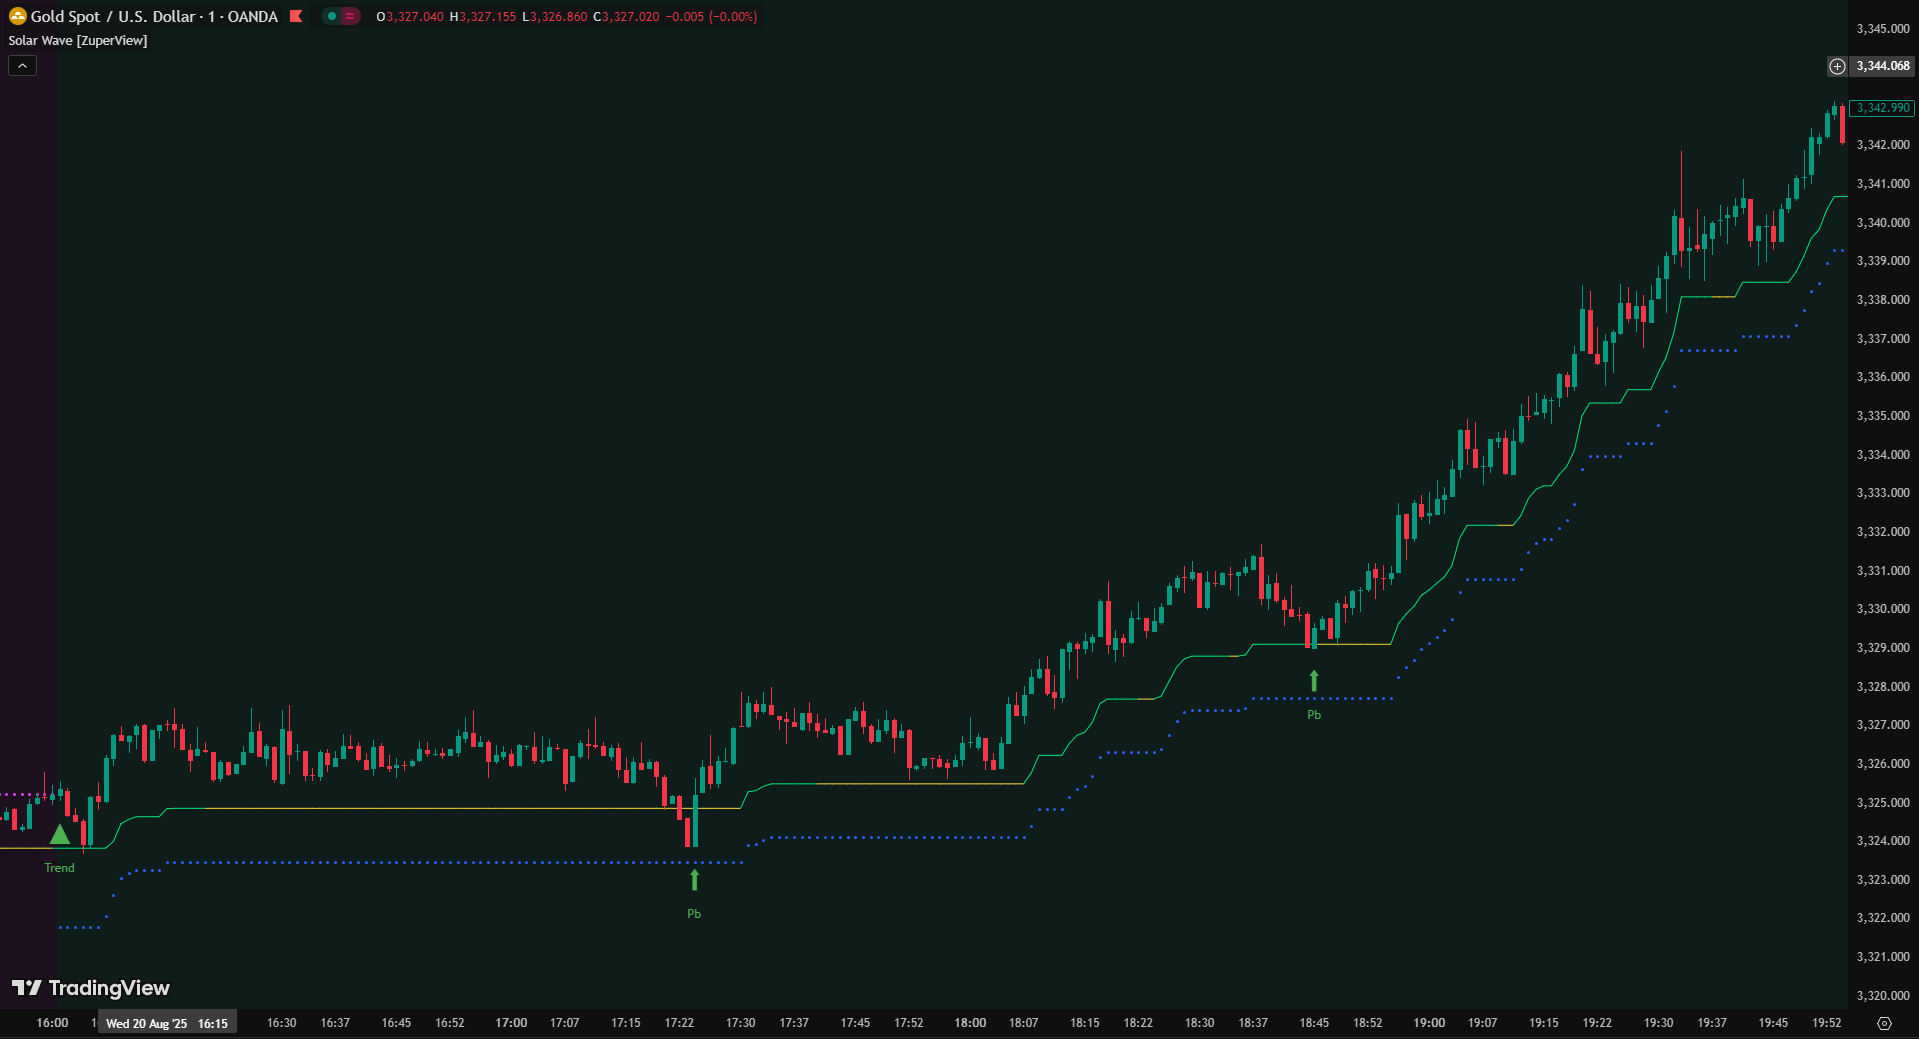
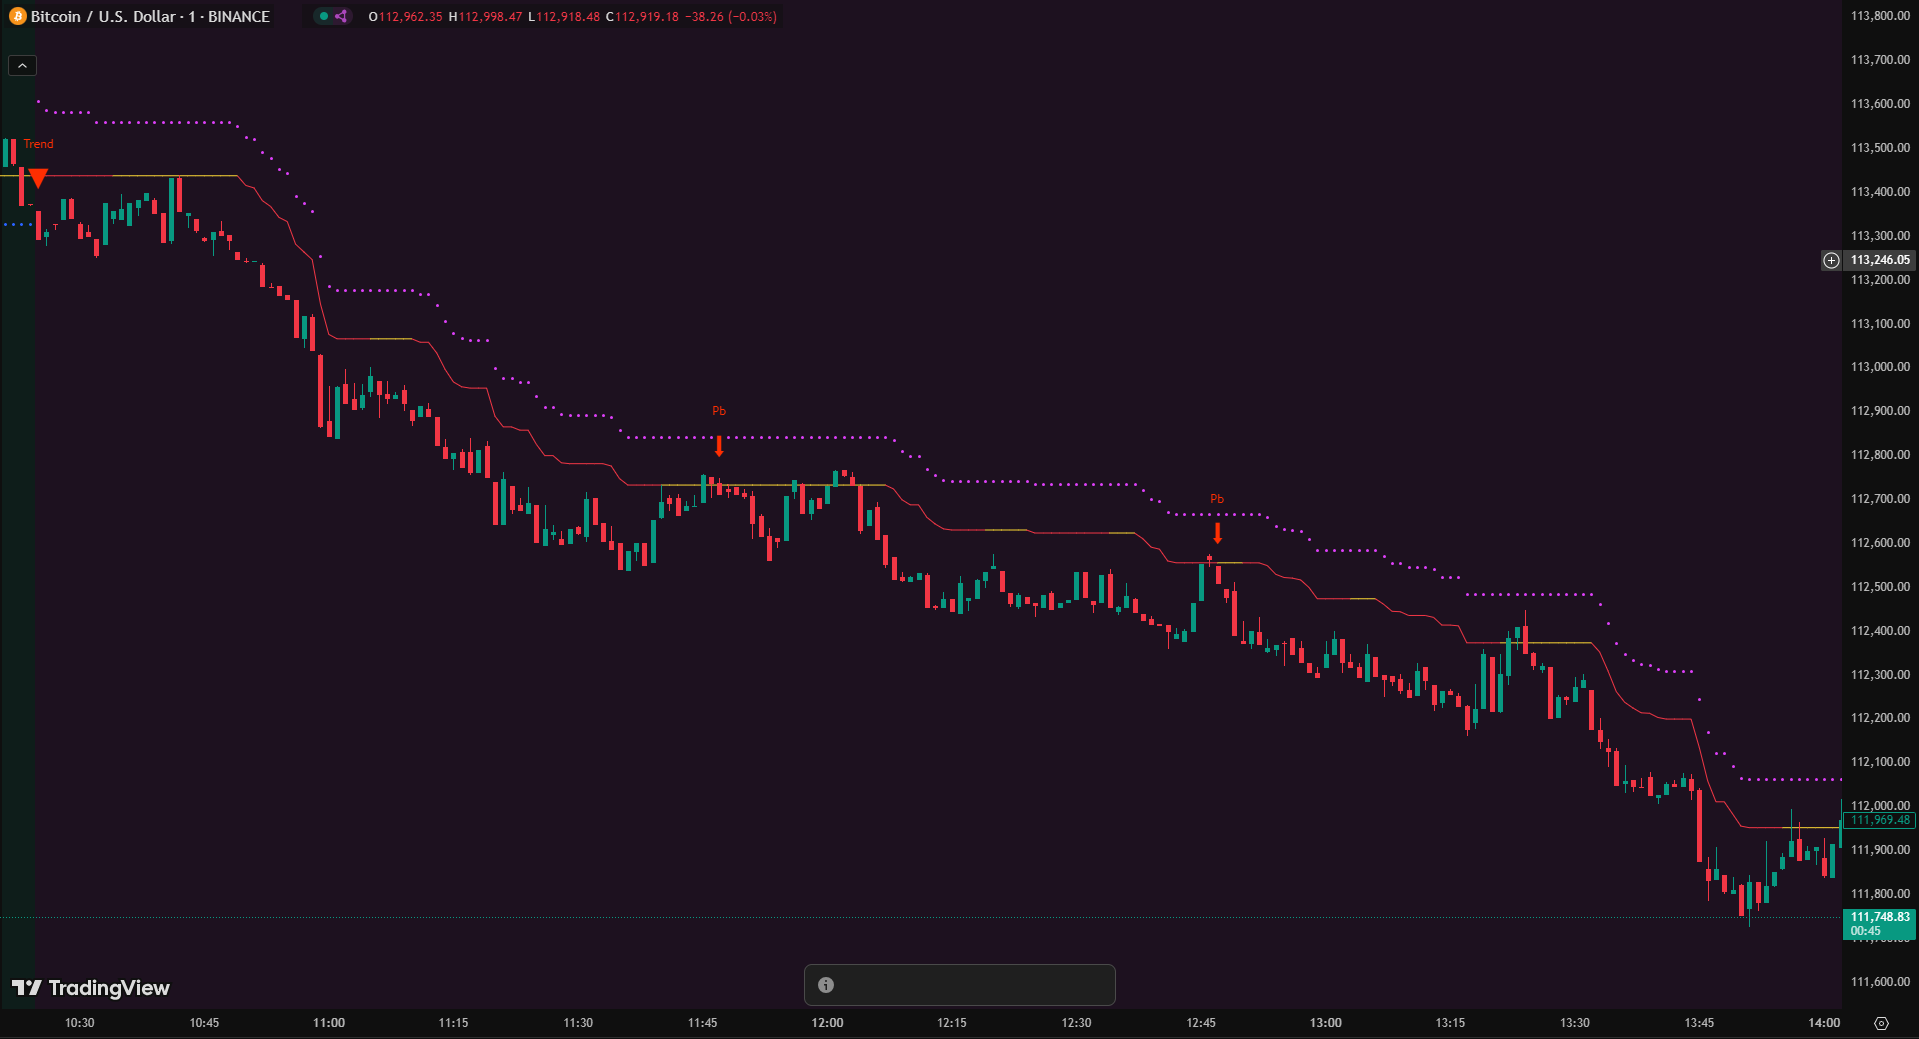
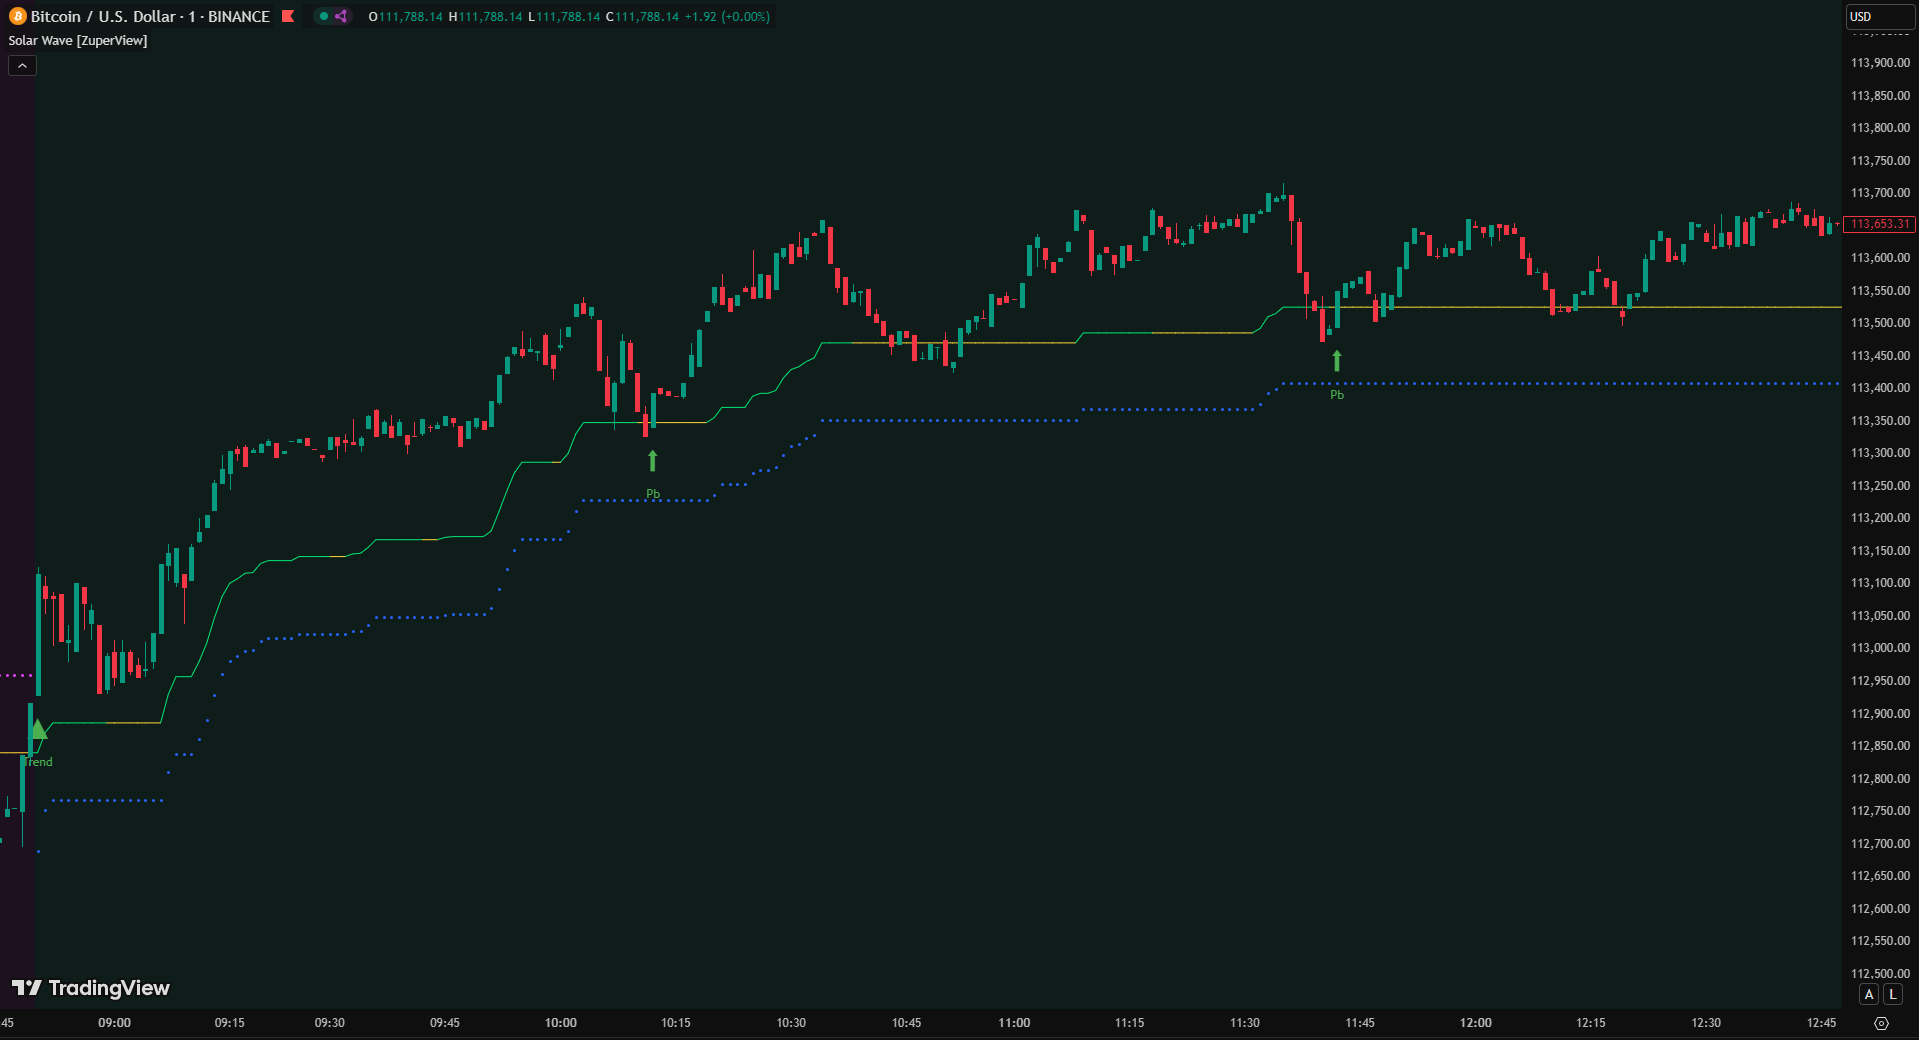
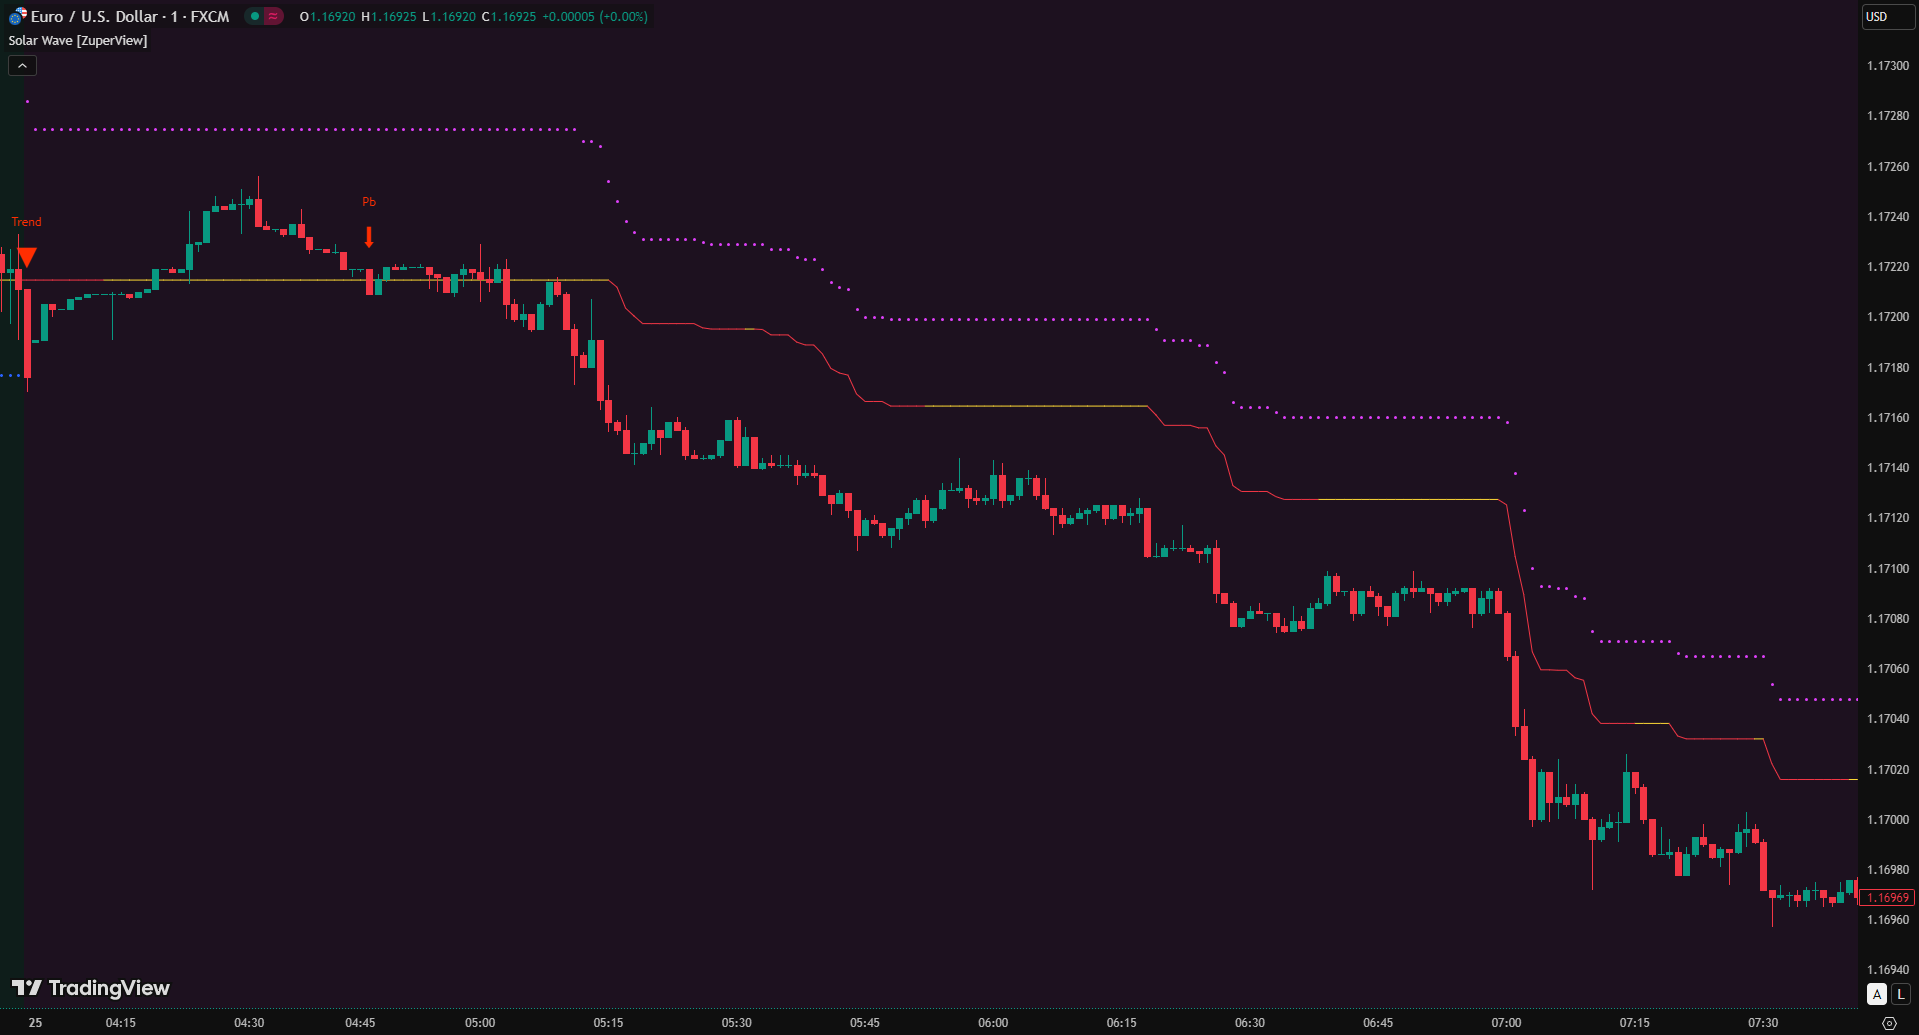
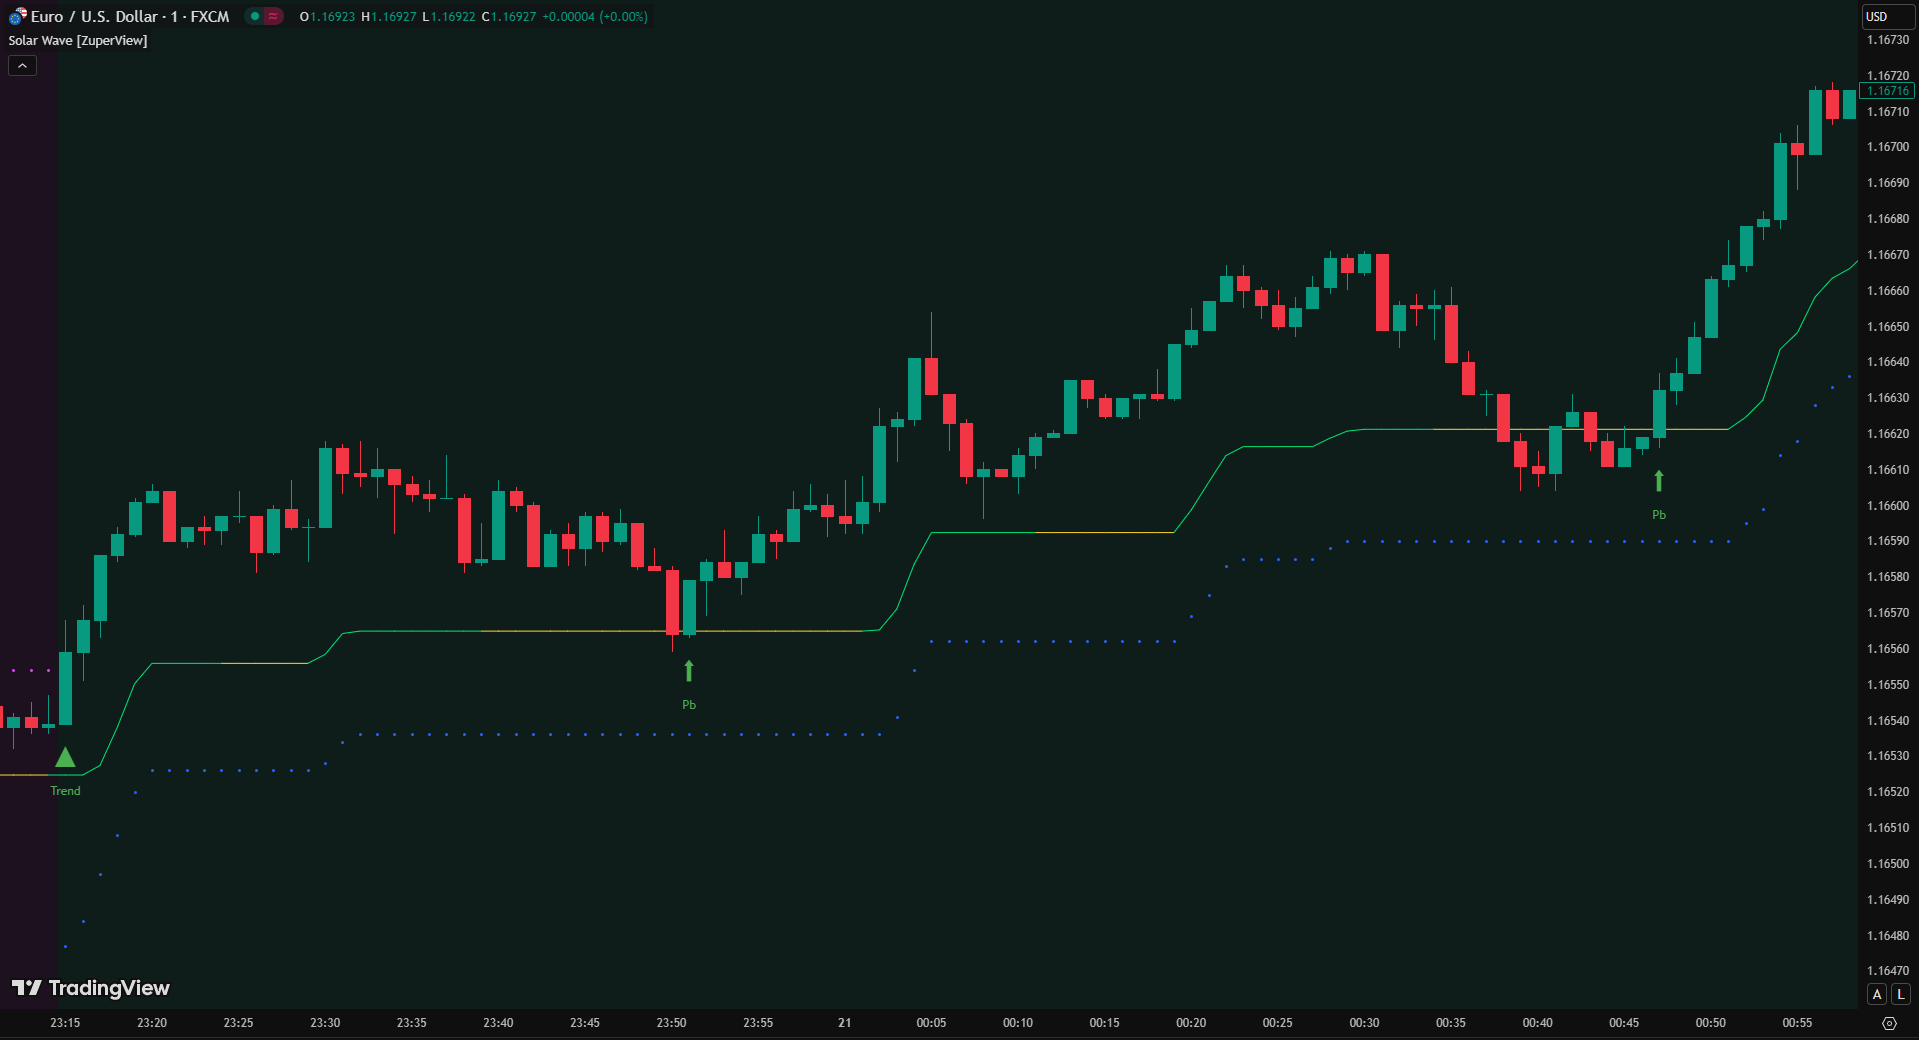
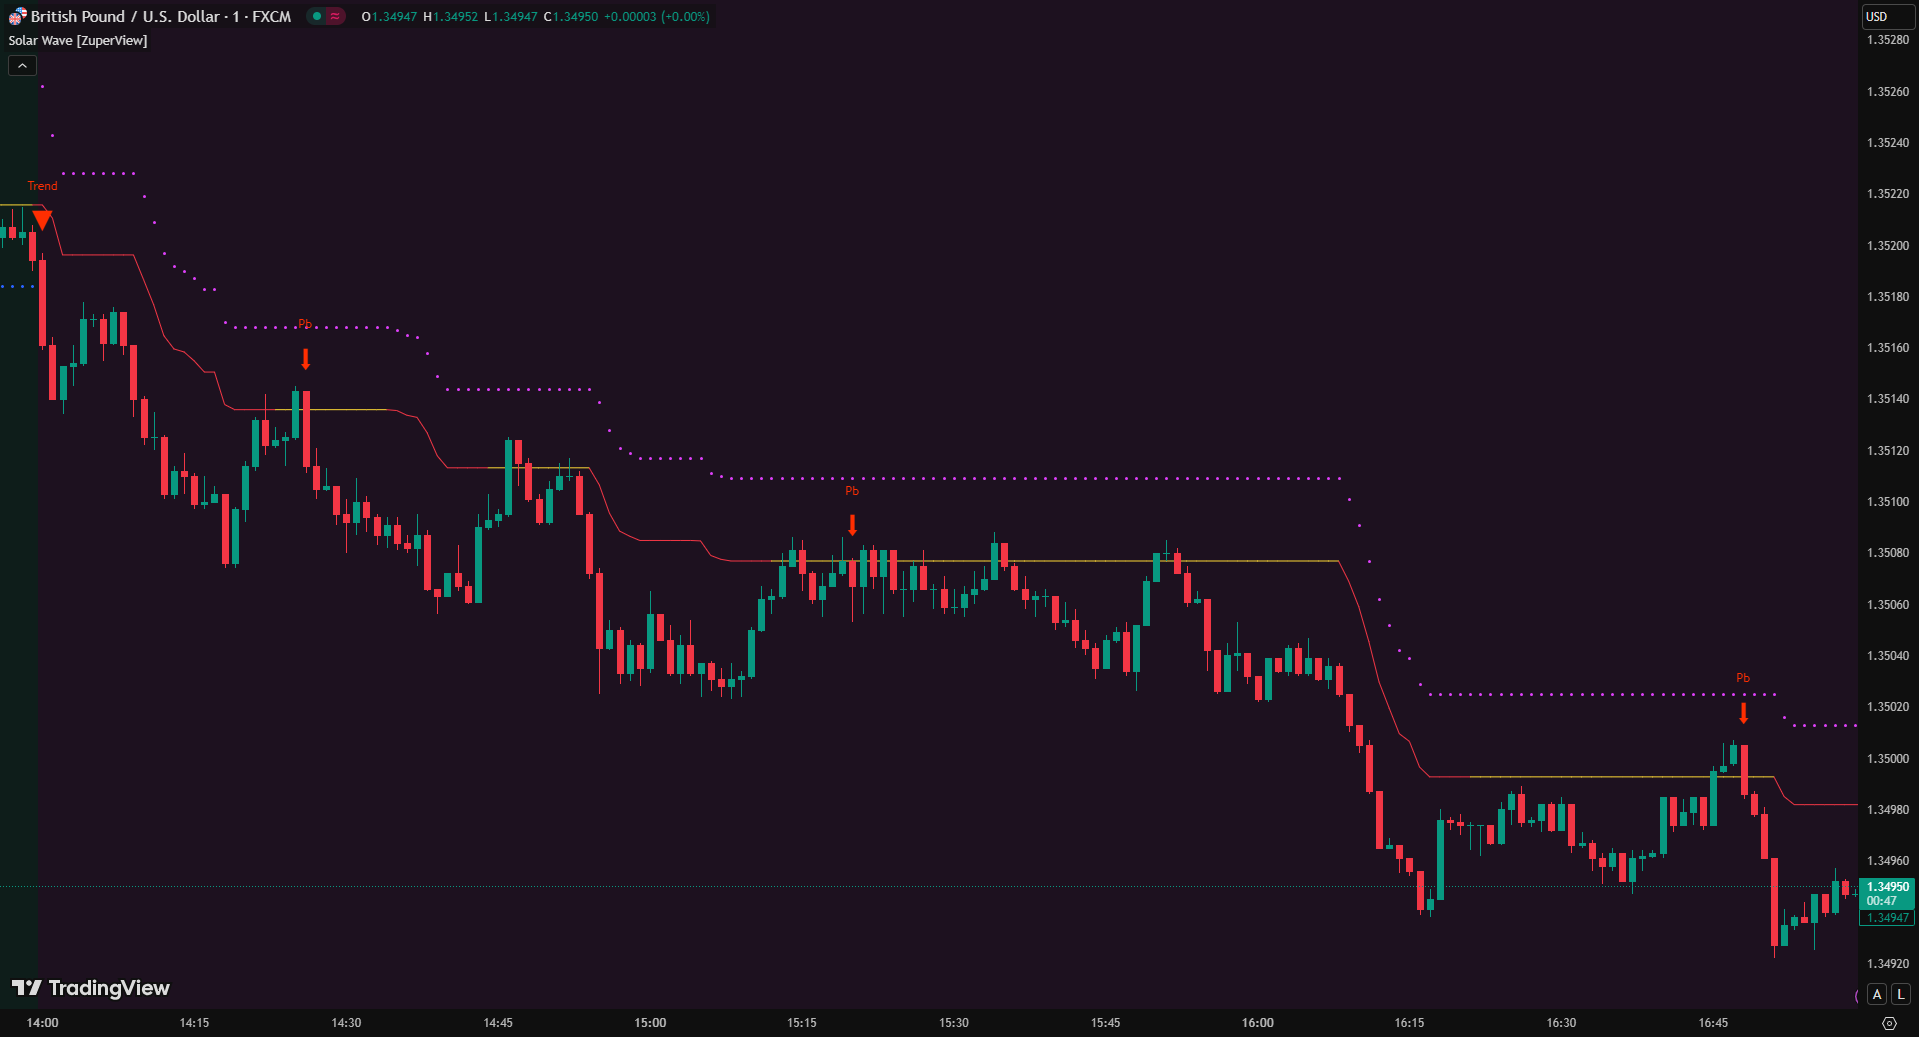
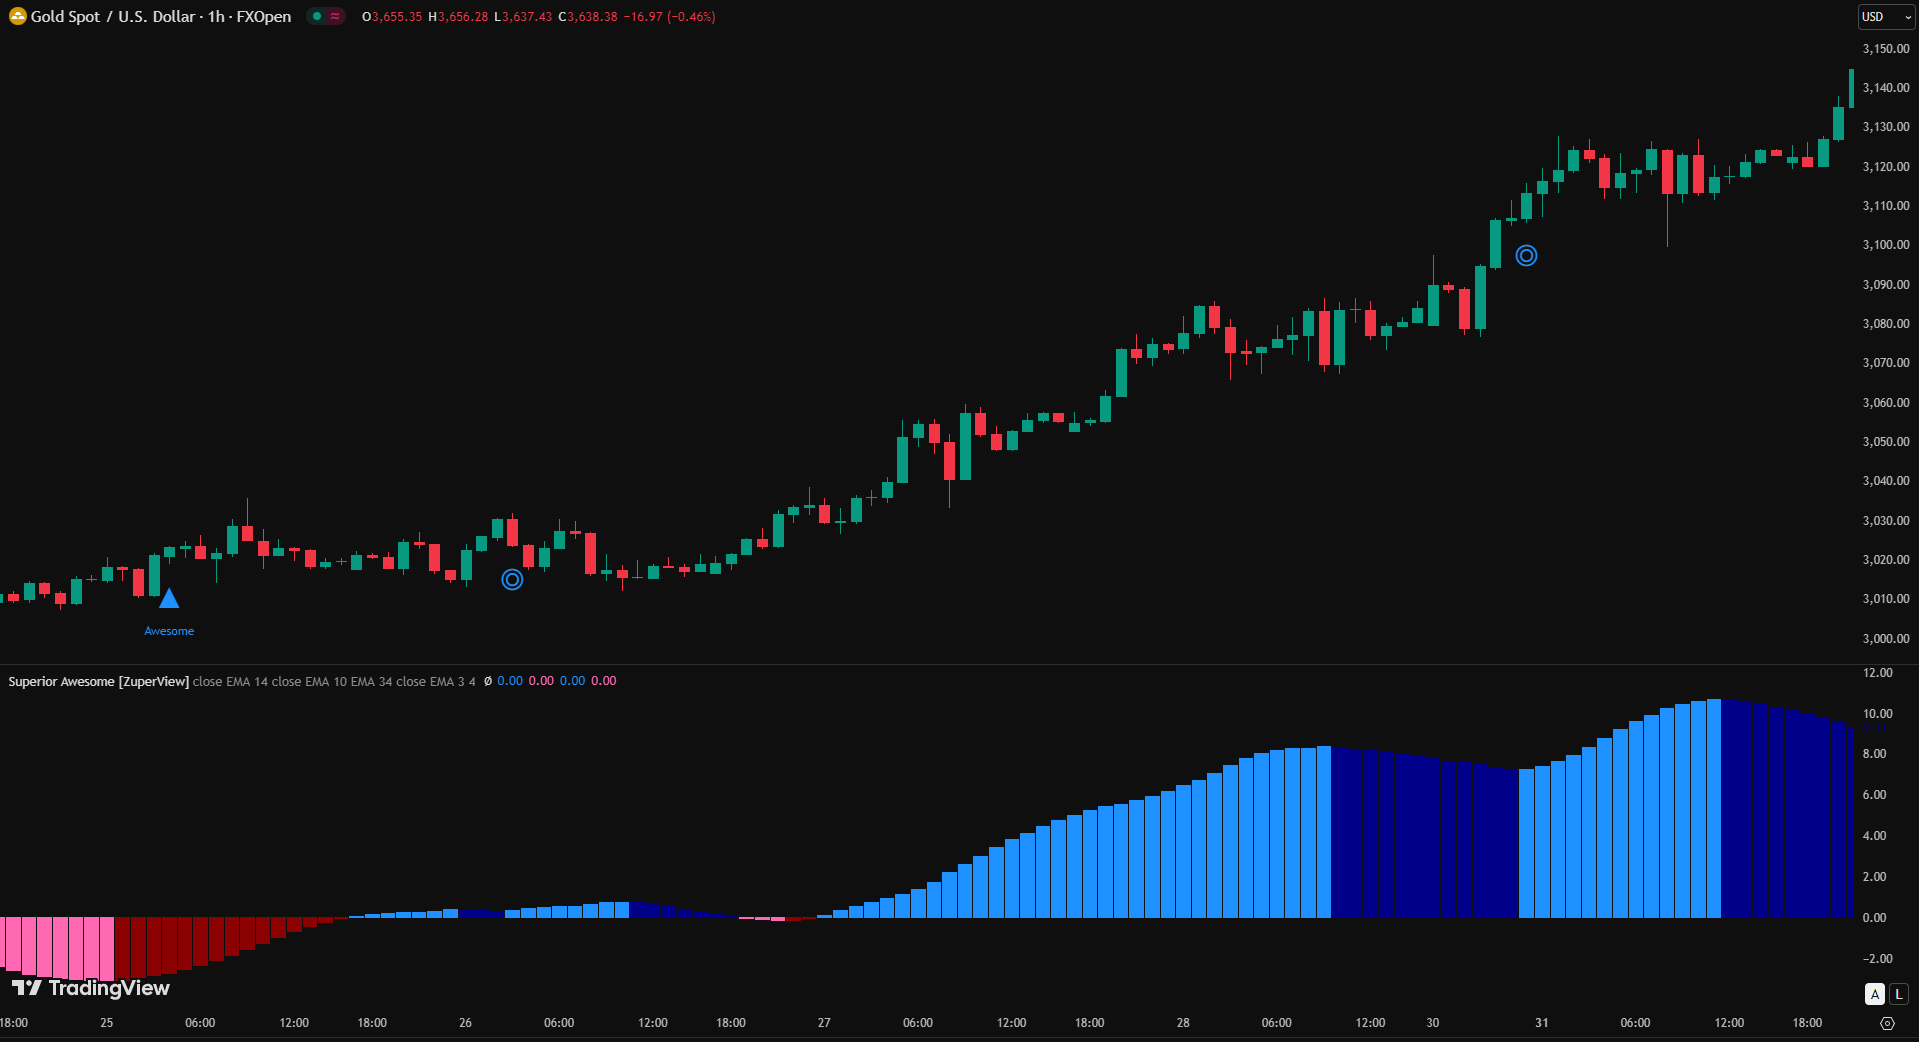
1. Solar Wave
Solar Wave is designed to measure both trend direction and strength in real time. By combining refined market volatility (ninZaATR) with pure price action, it removes lag common in traditional indicators. The system highlights reliable pullback opportunities, helping you enter trends at optimal points, and provides a built-in trailing stop to manage exits objectively. This makes it a practical indicator for both swing trading and intraday strategies.

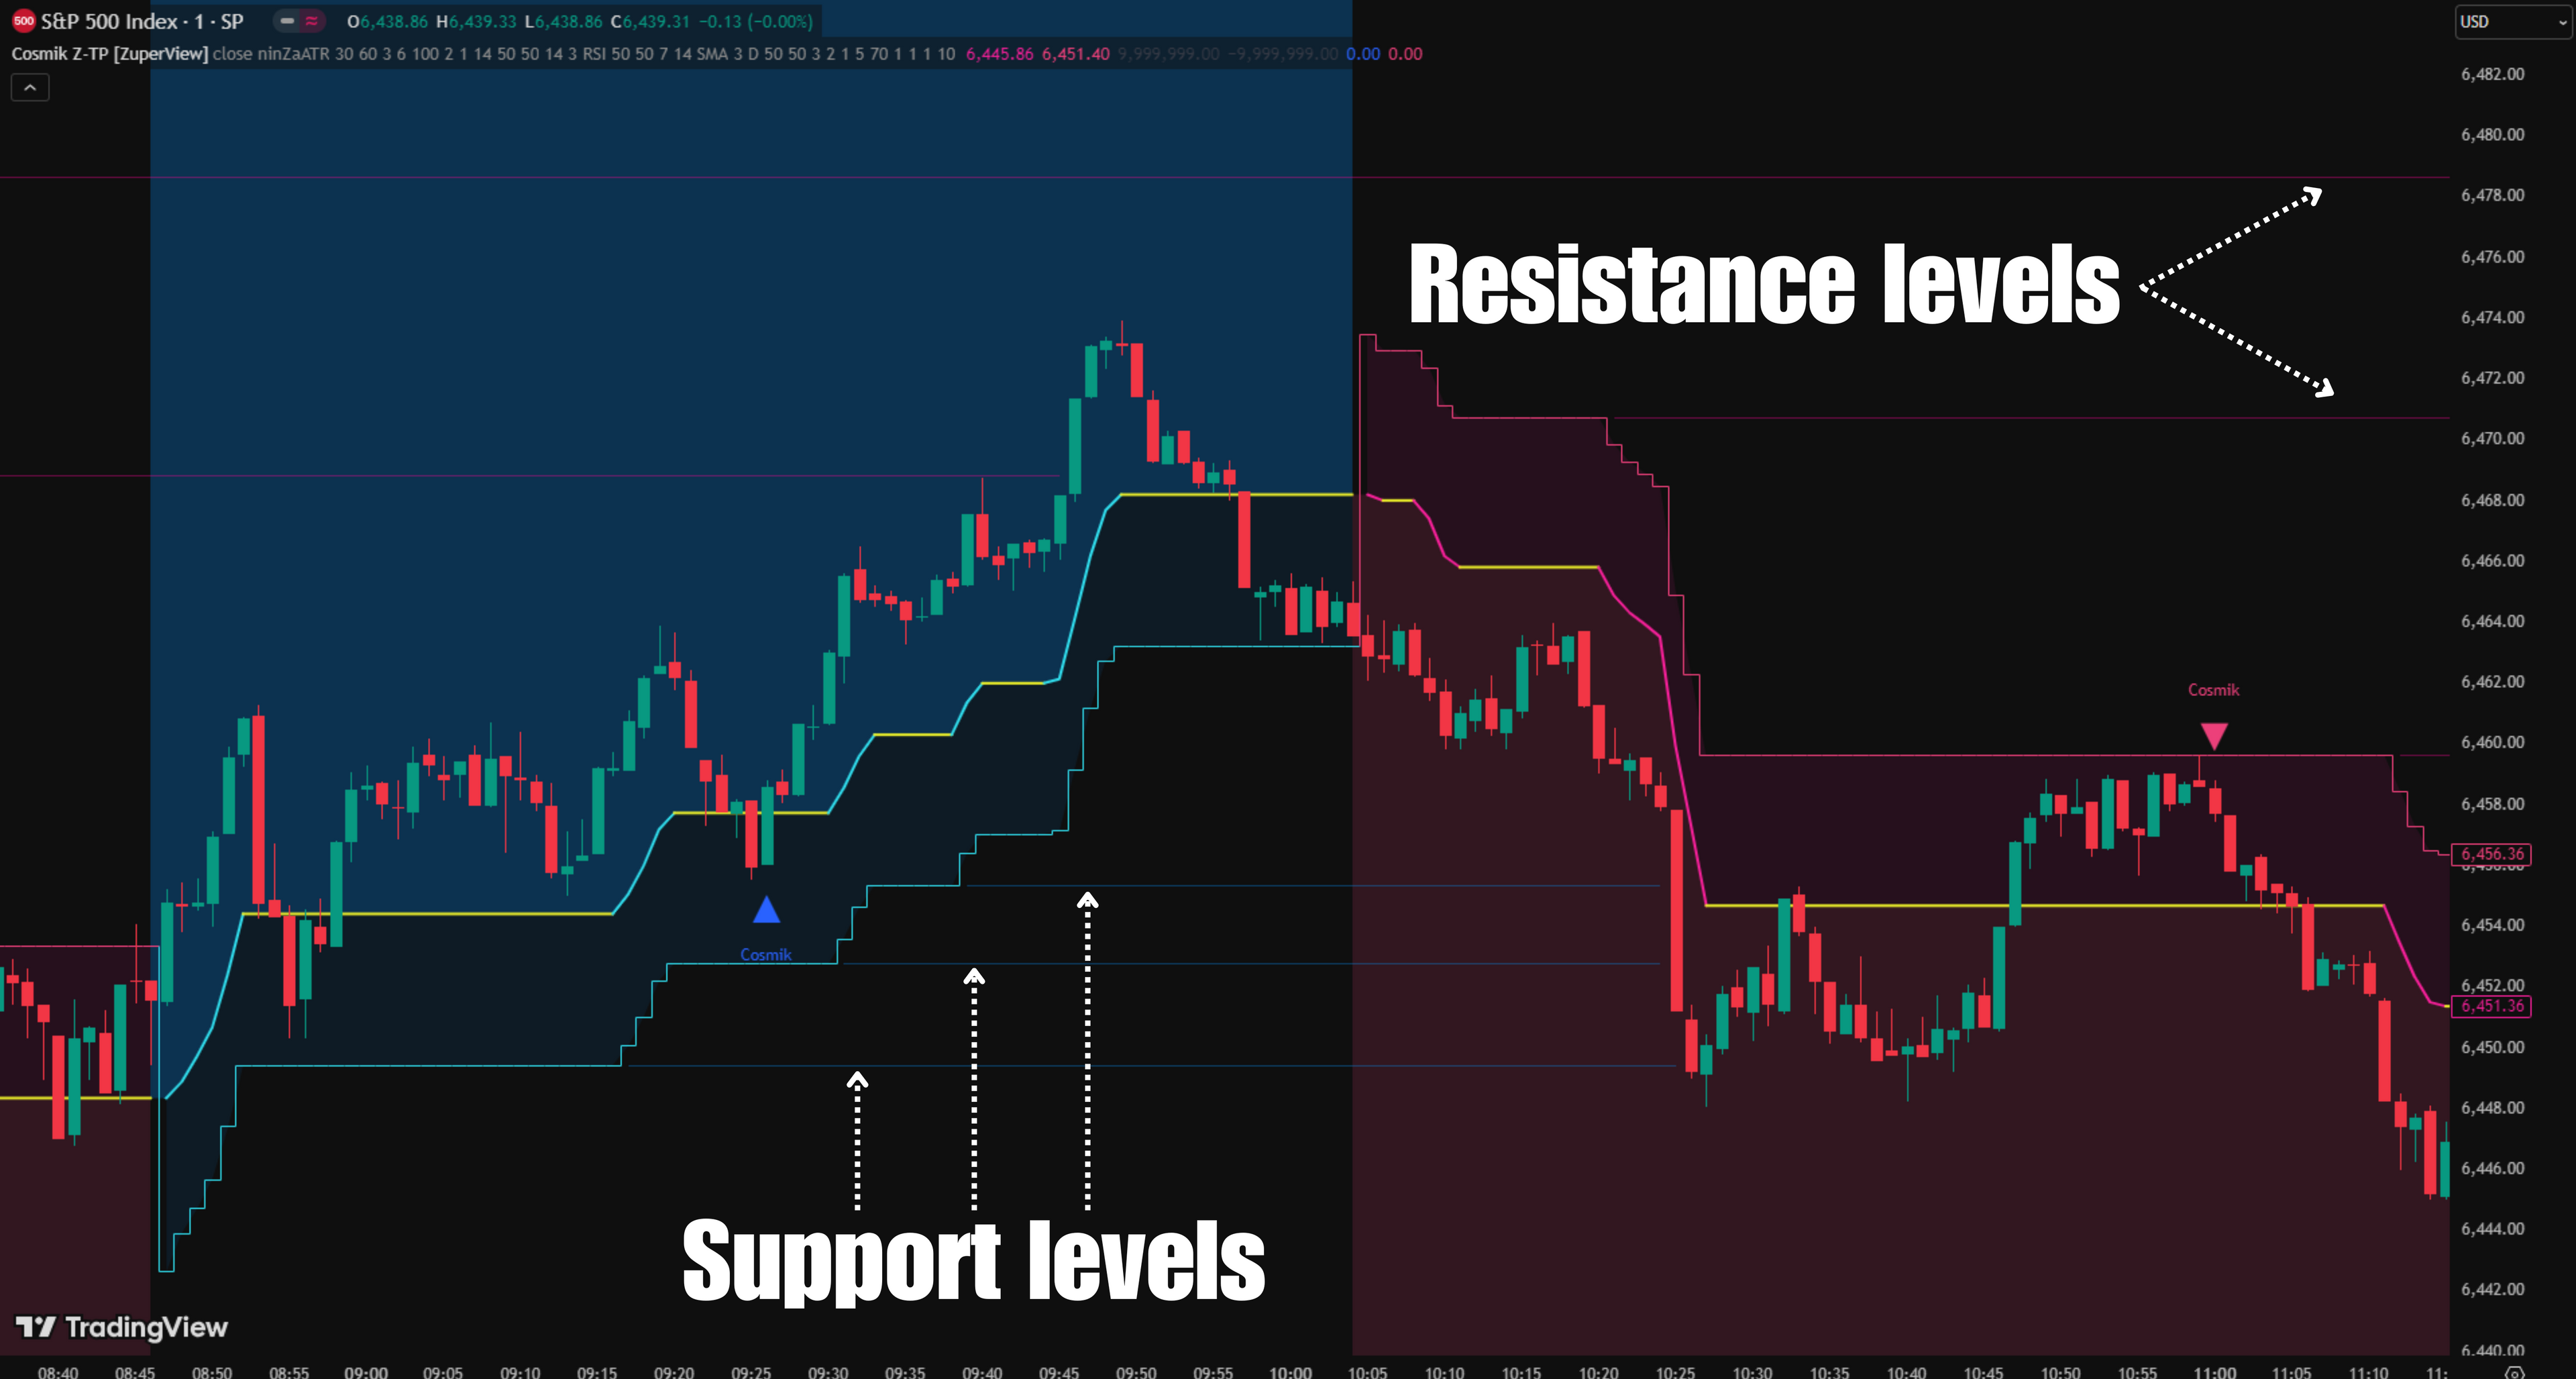
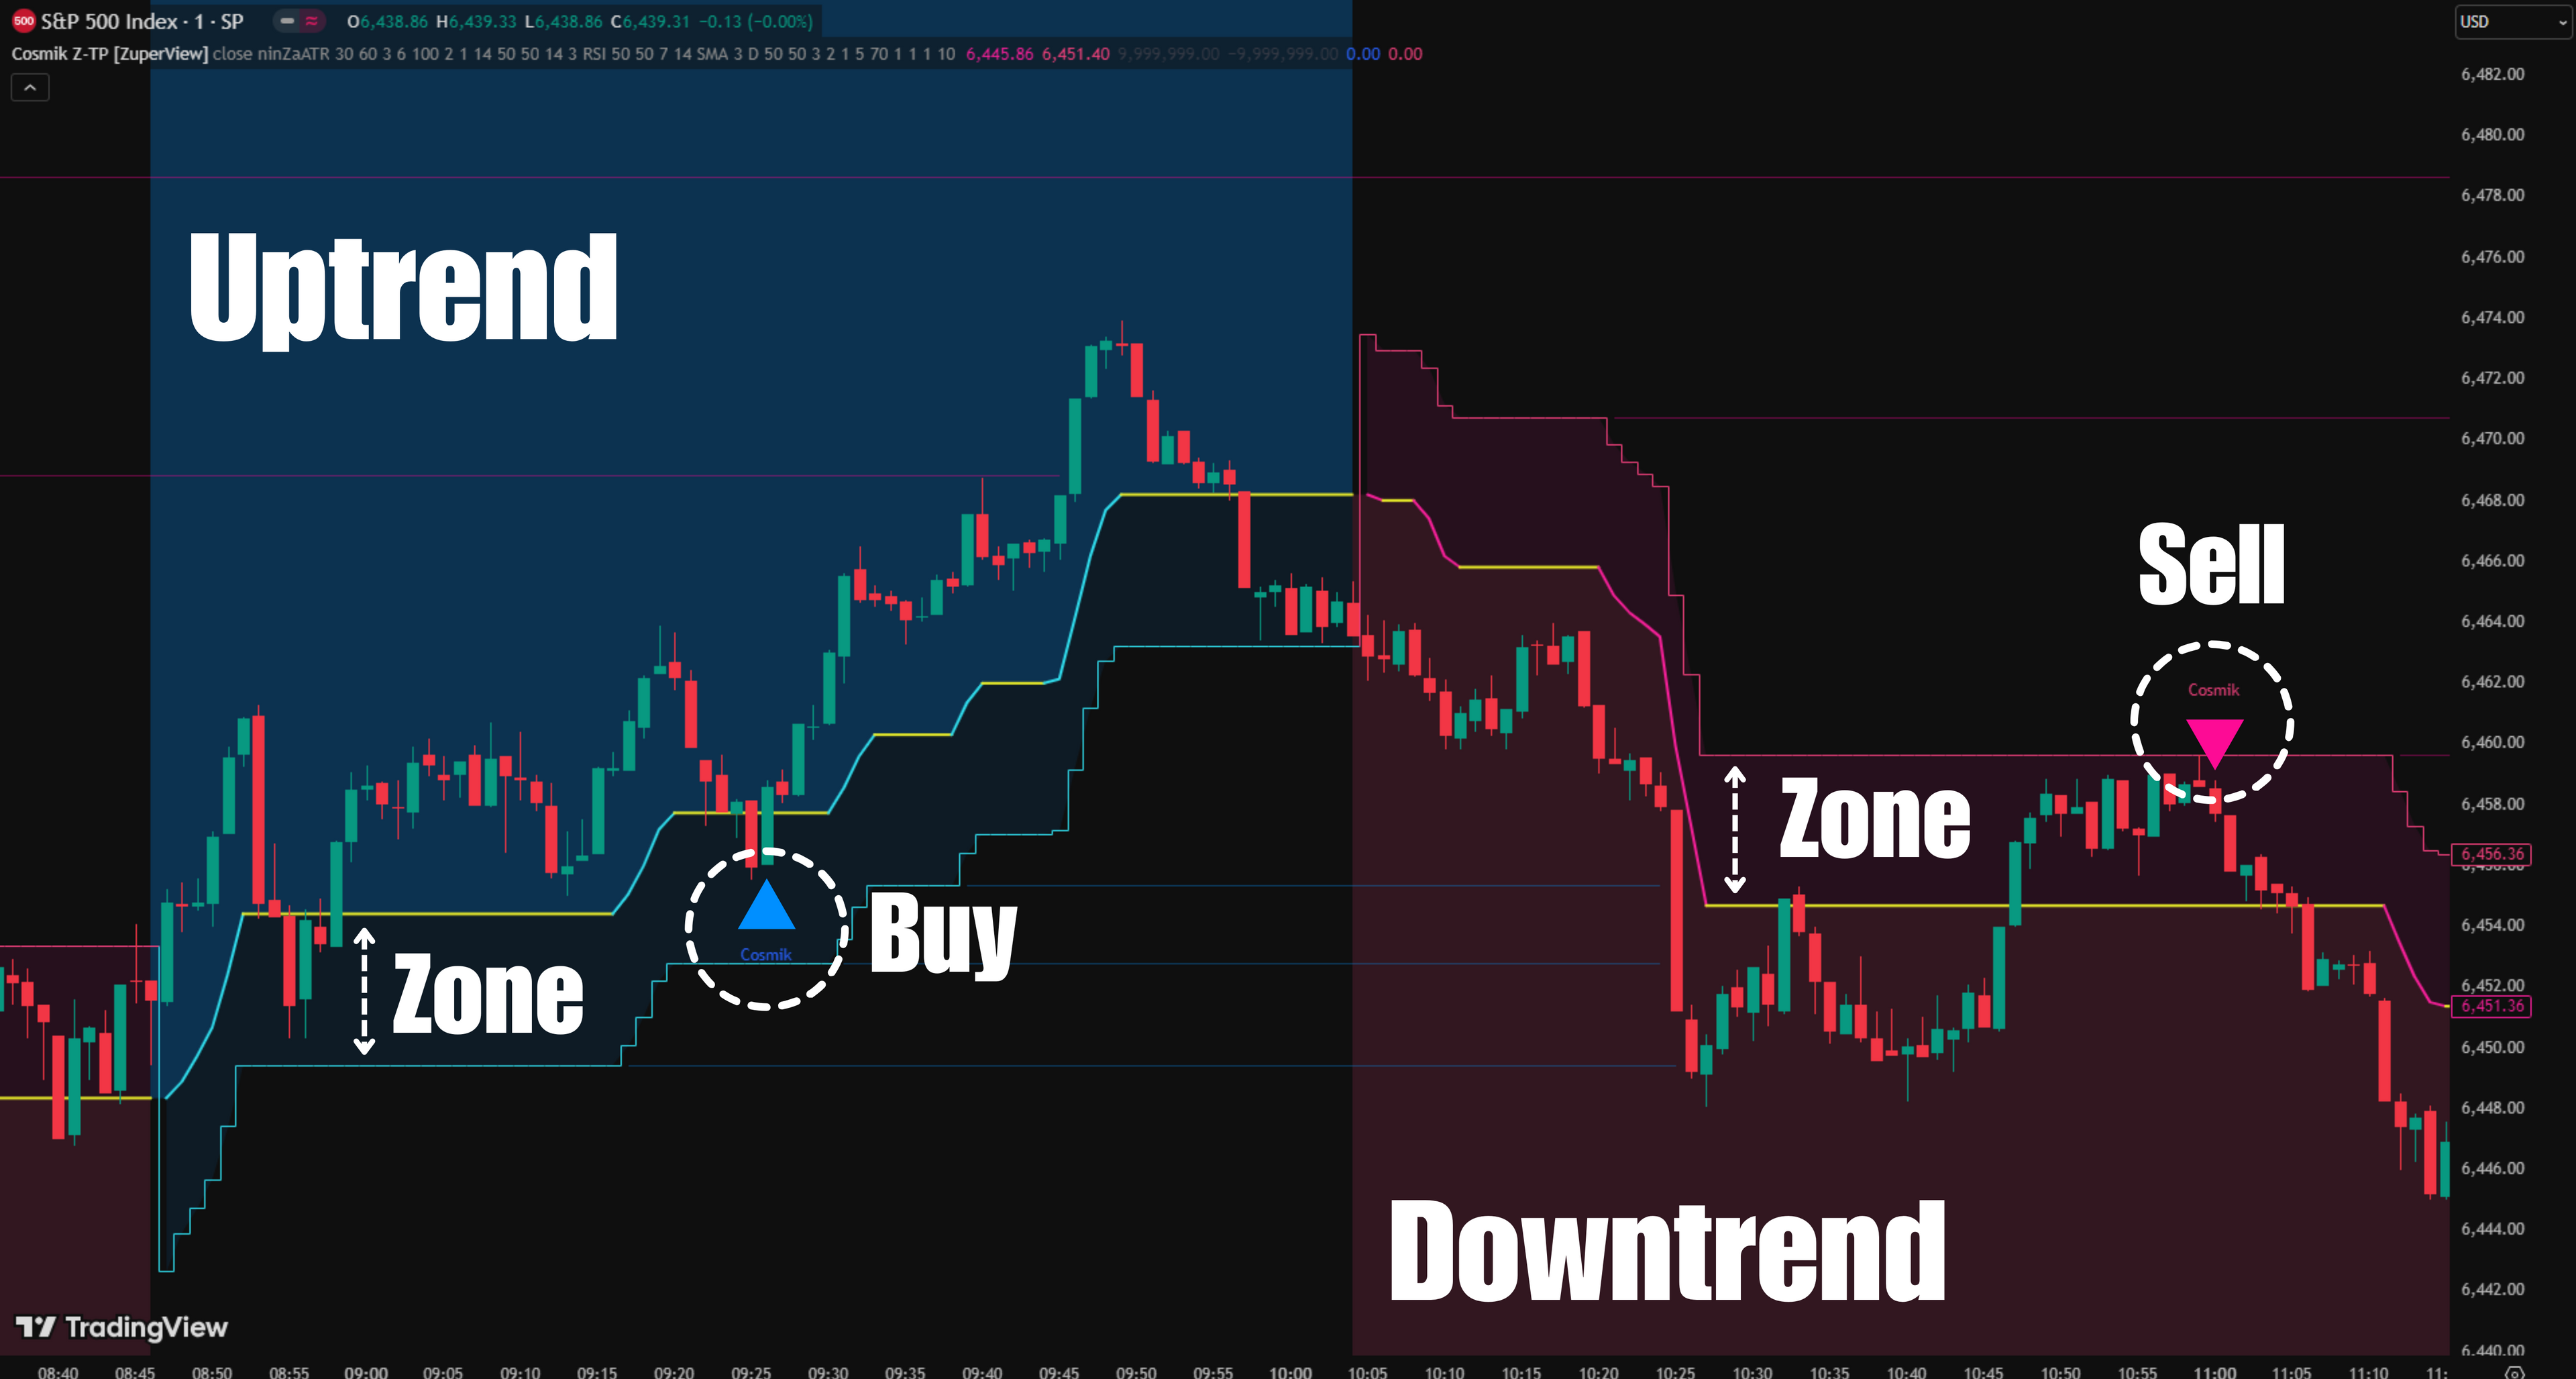
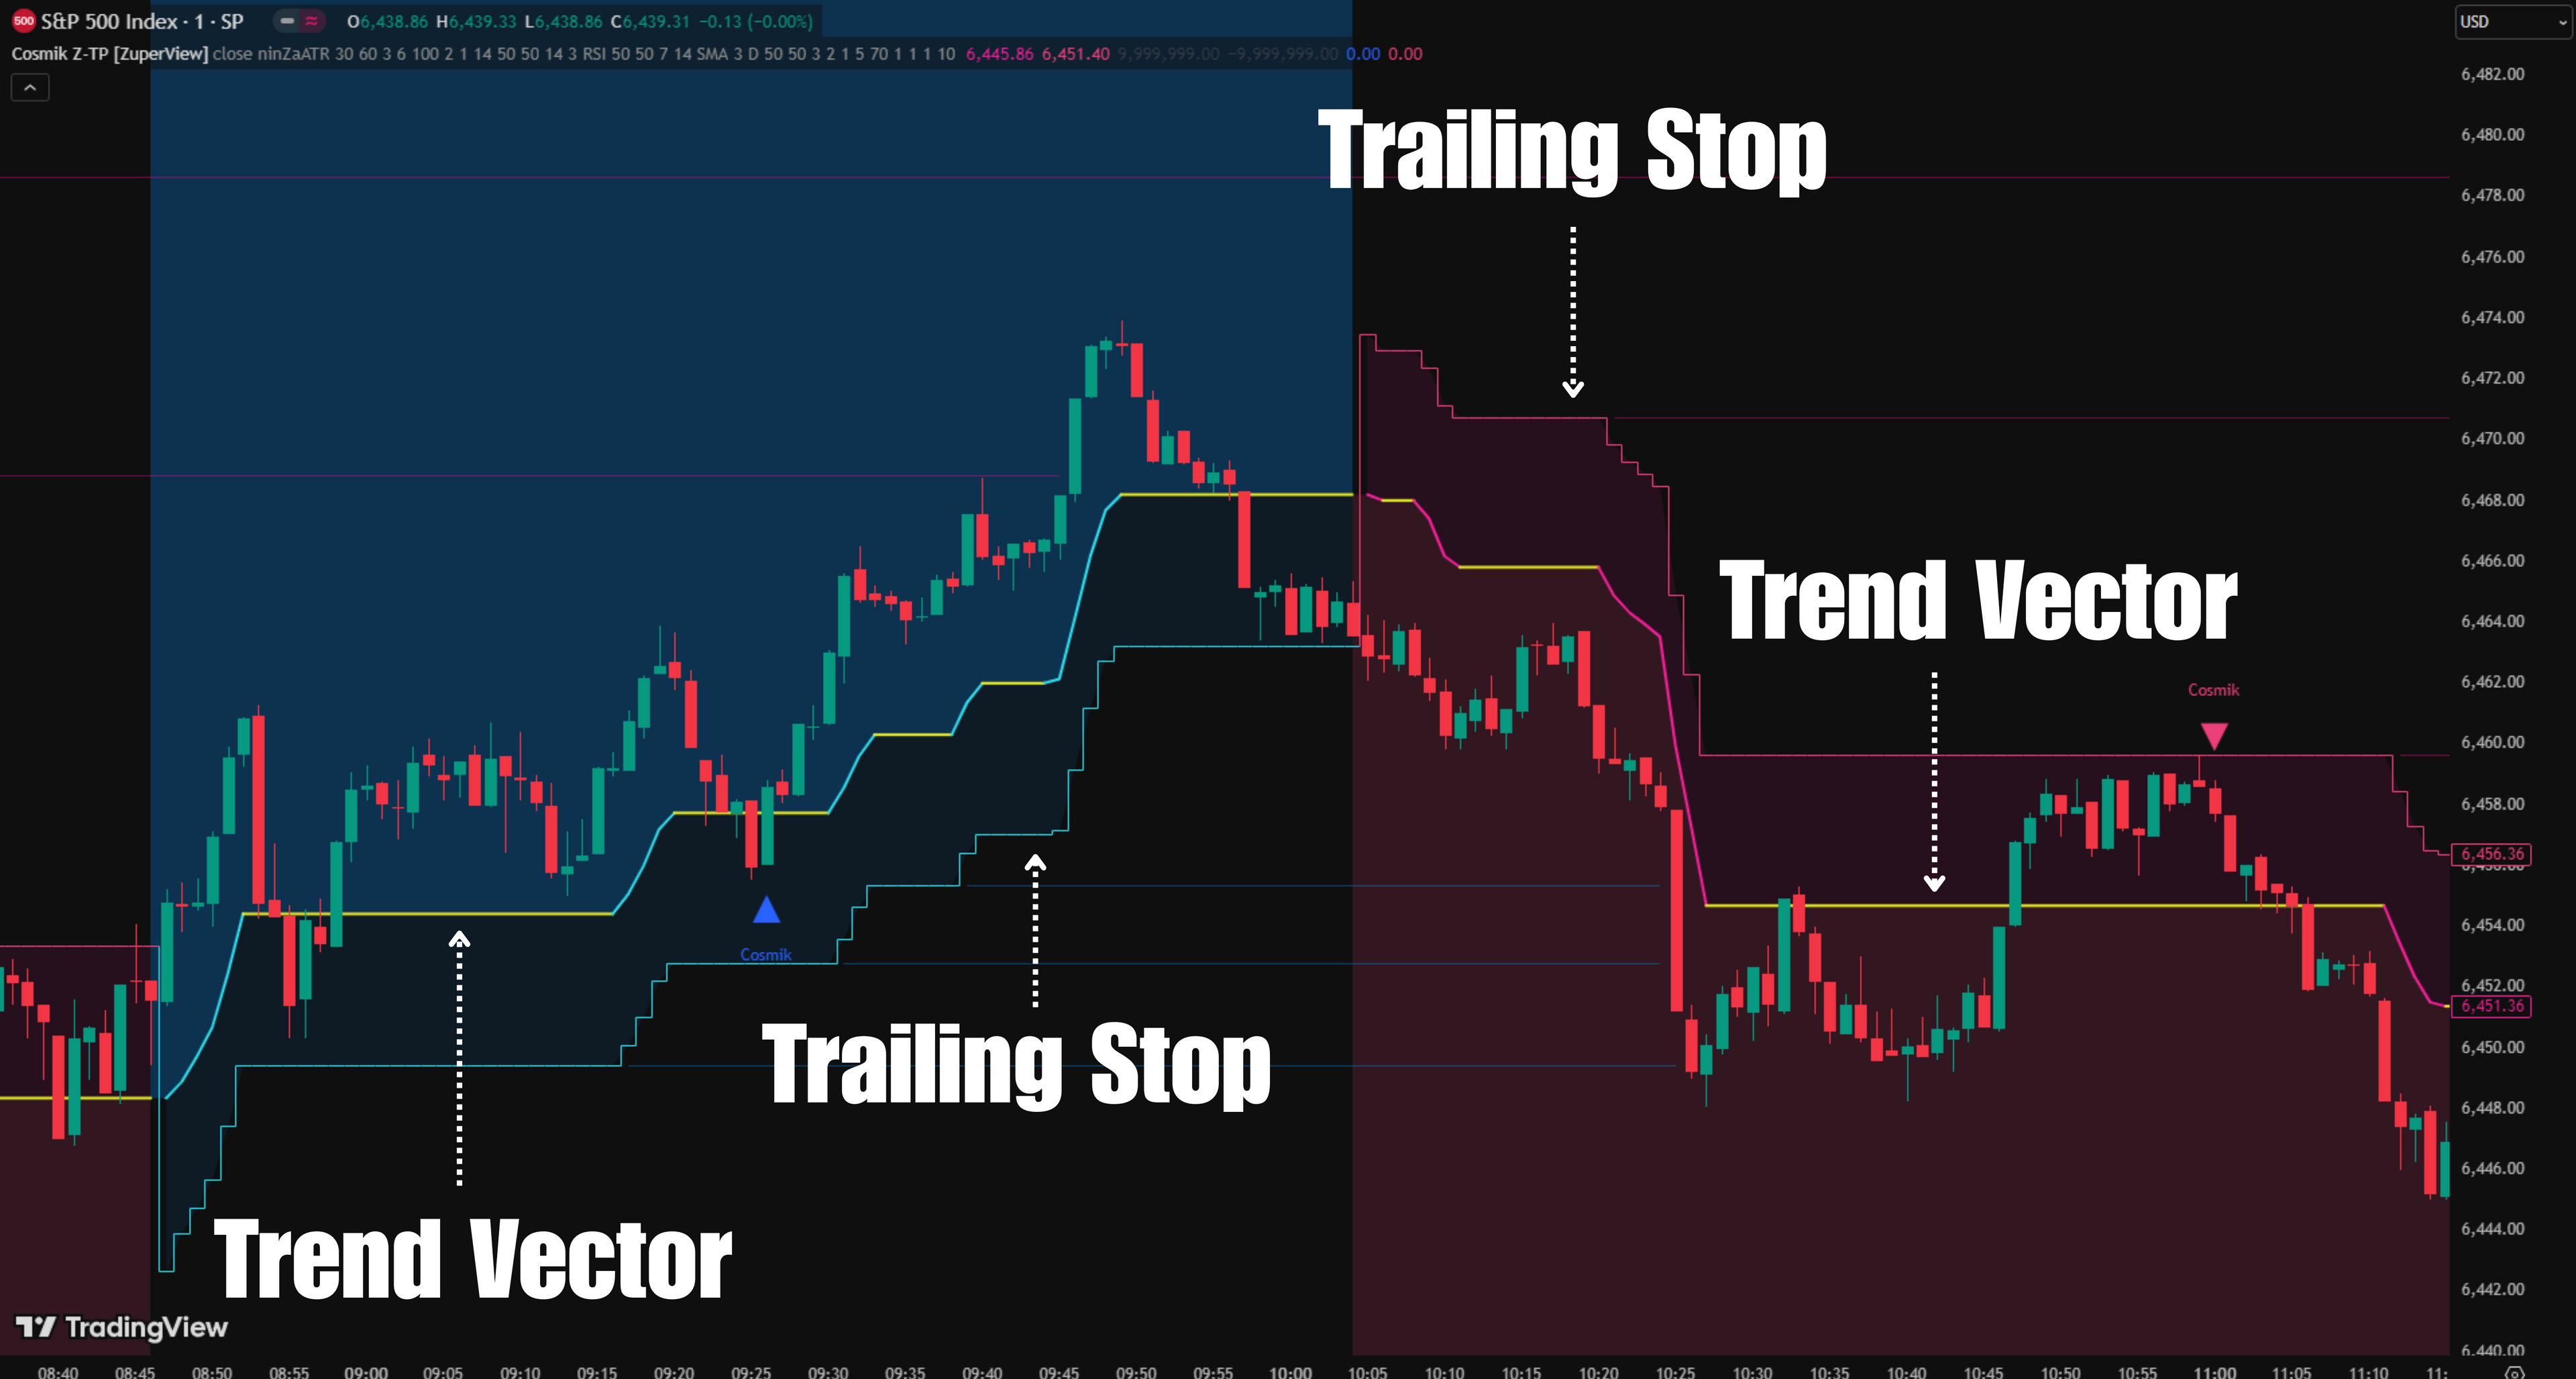
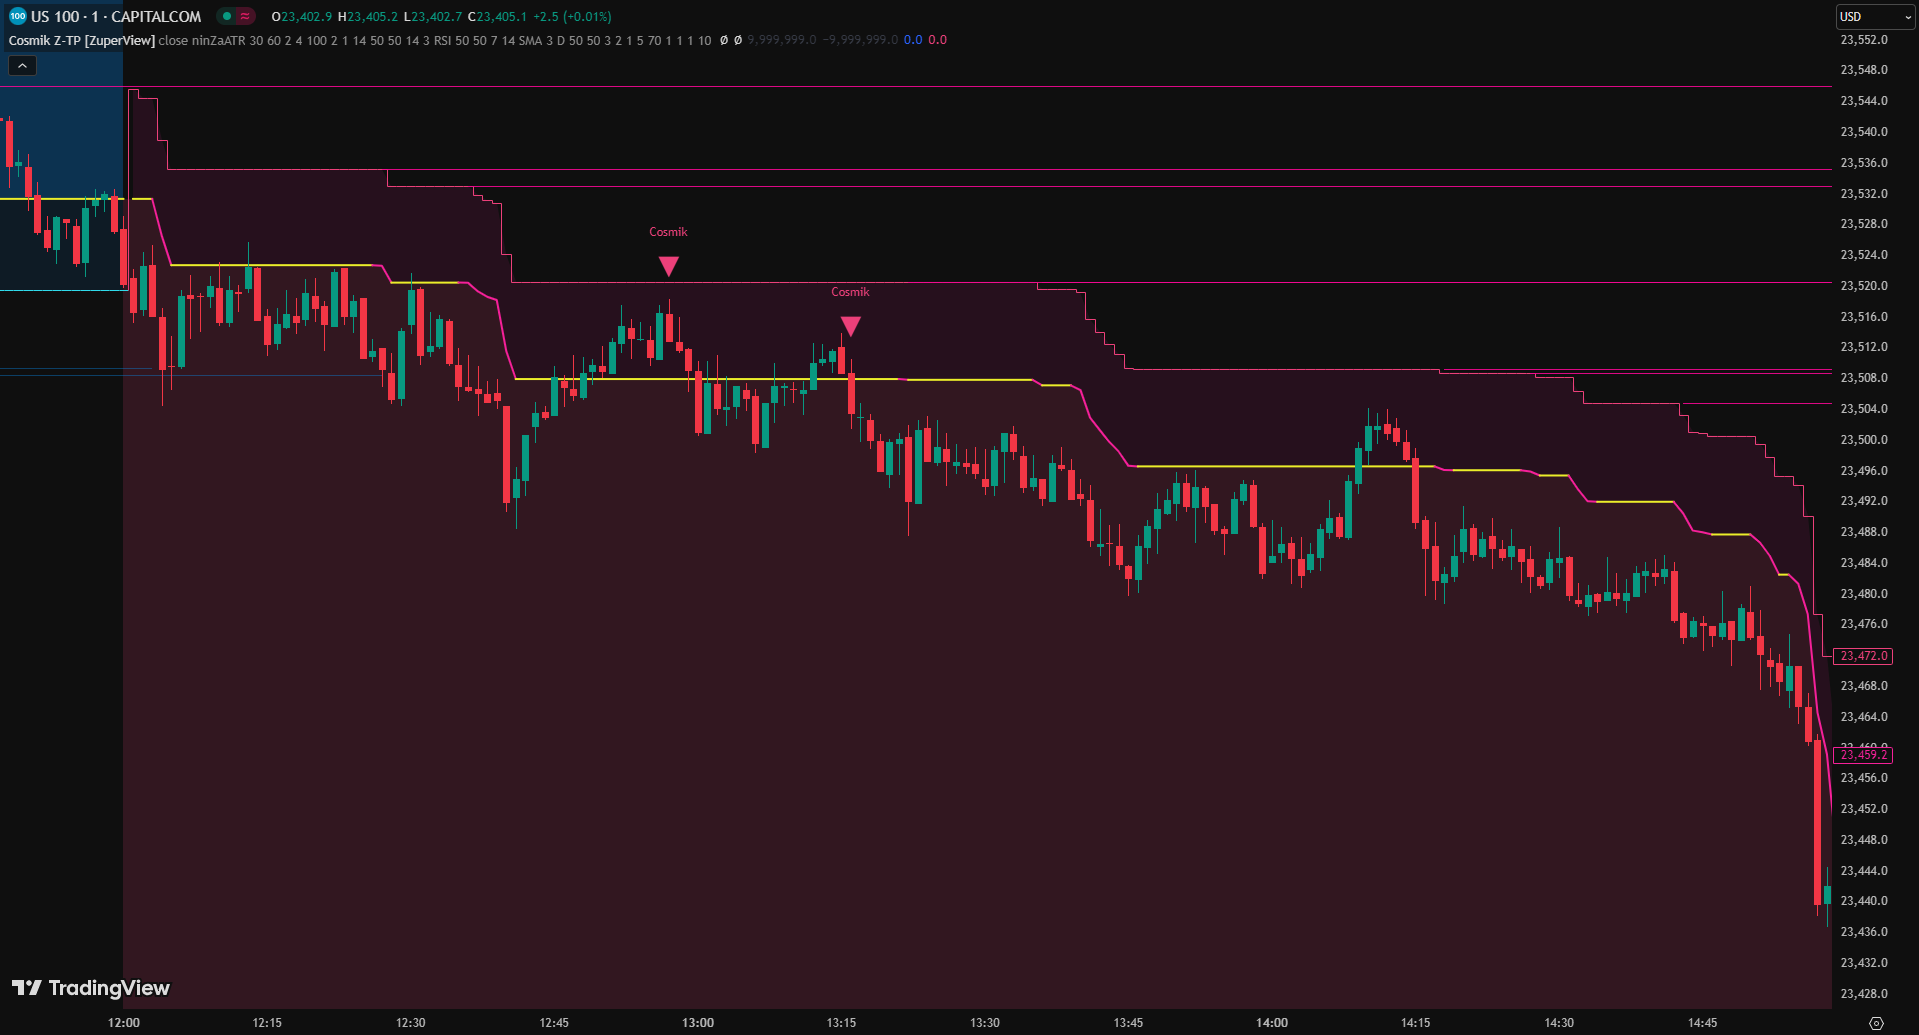
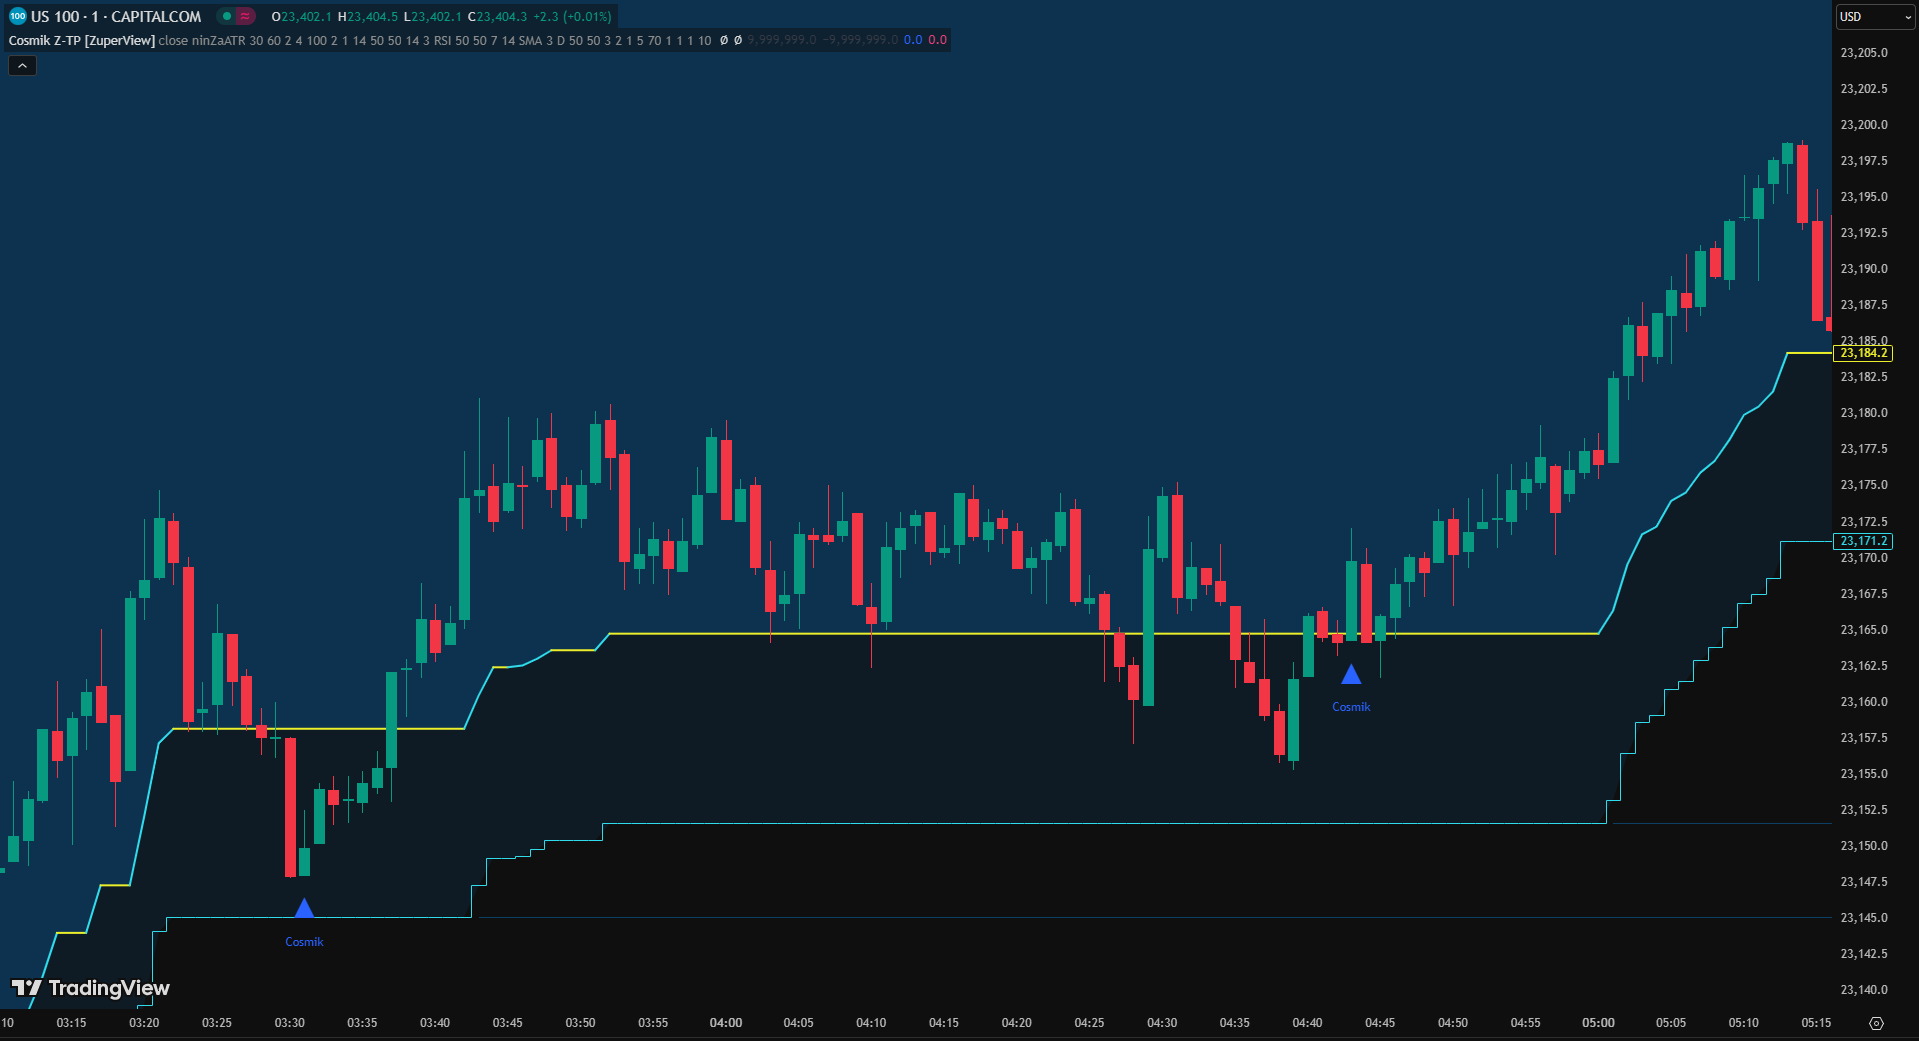
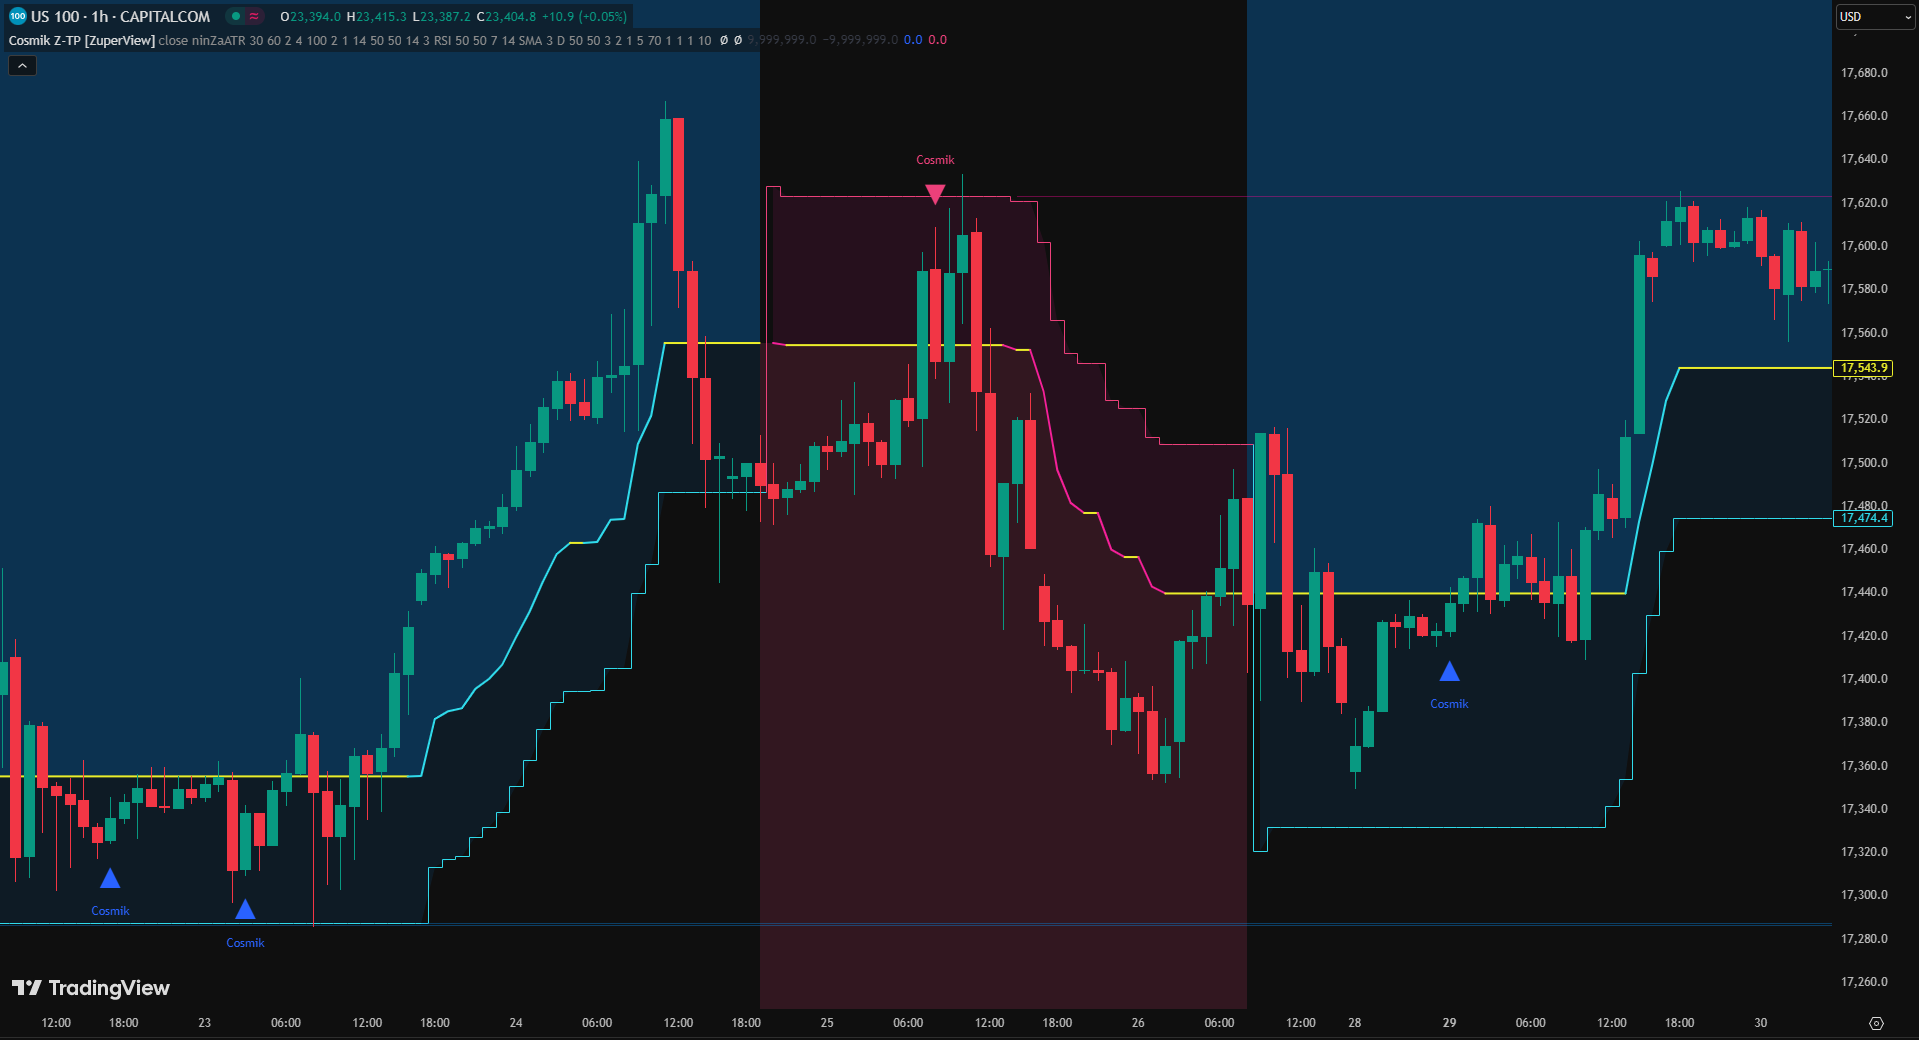
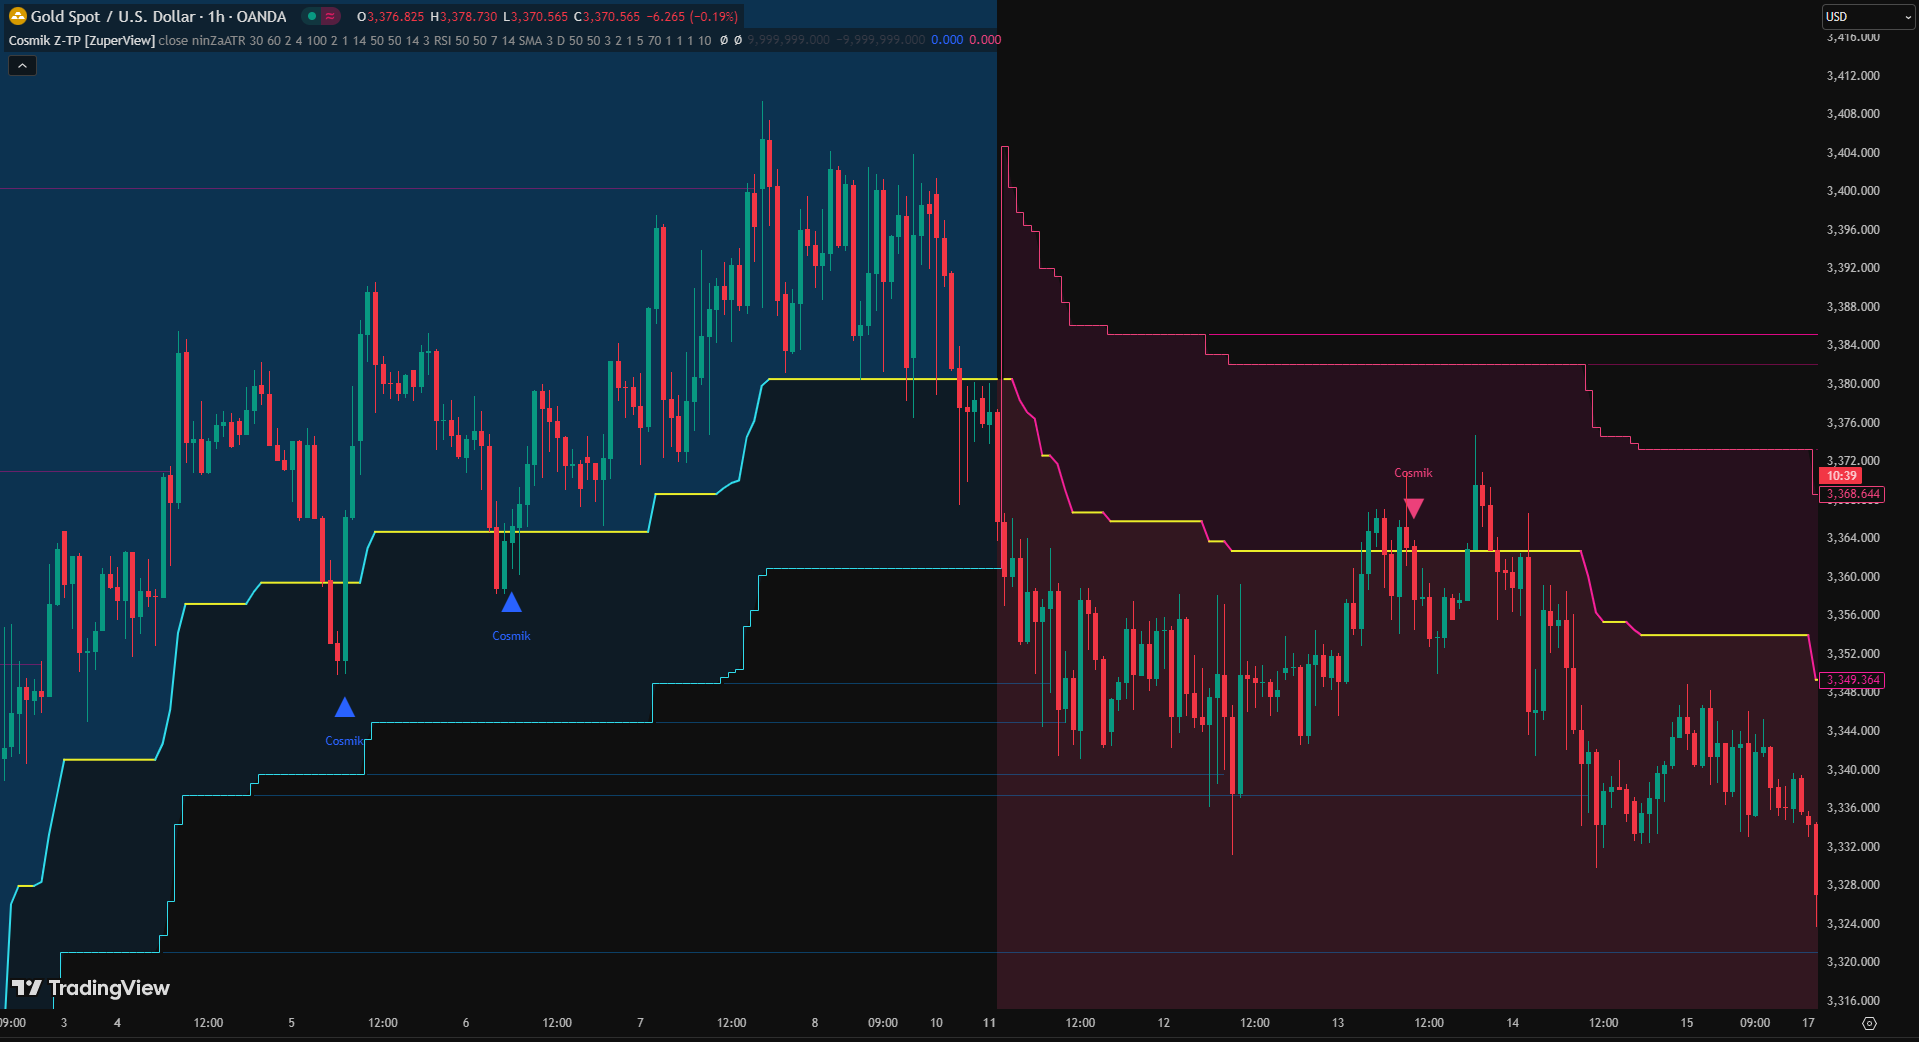
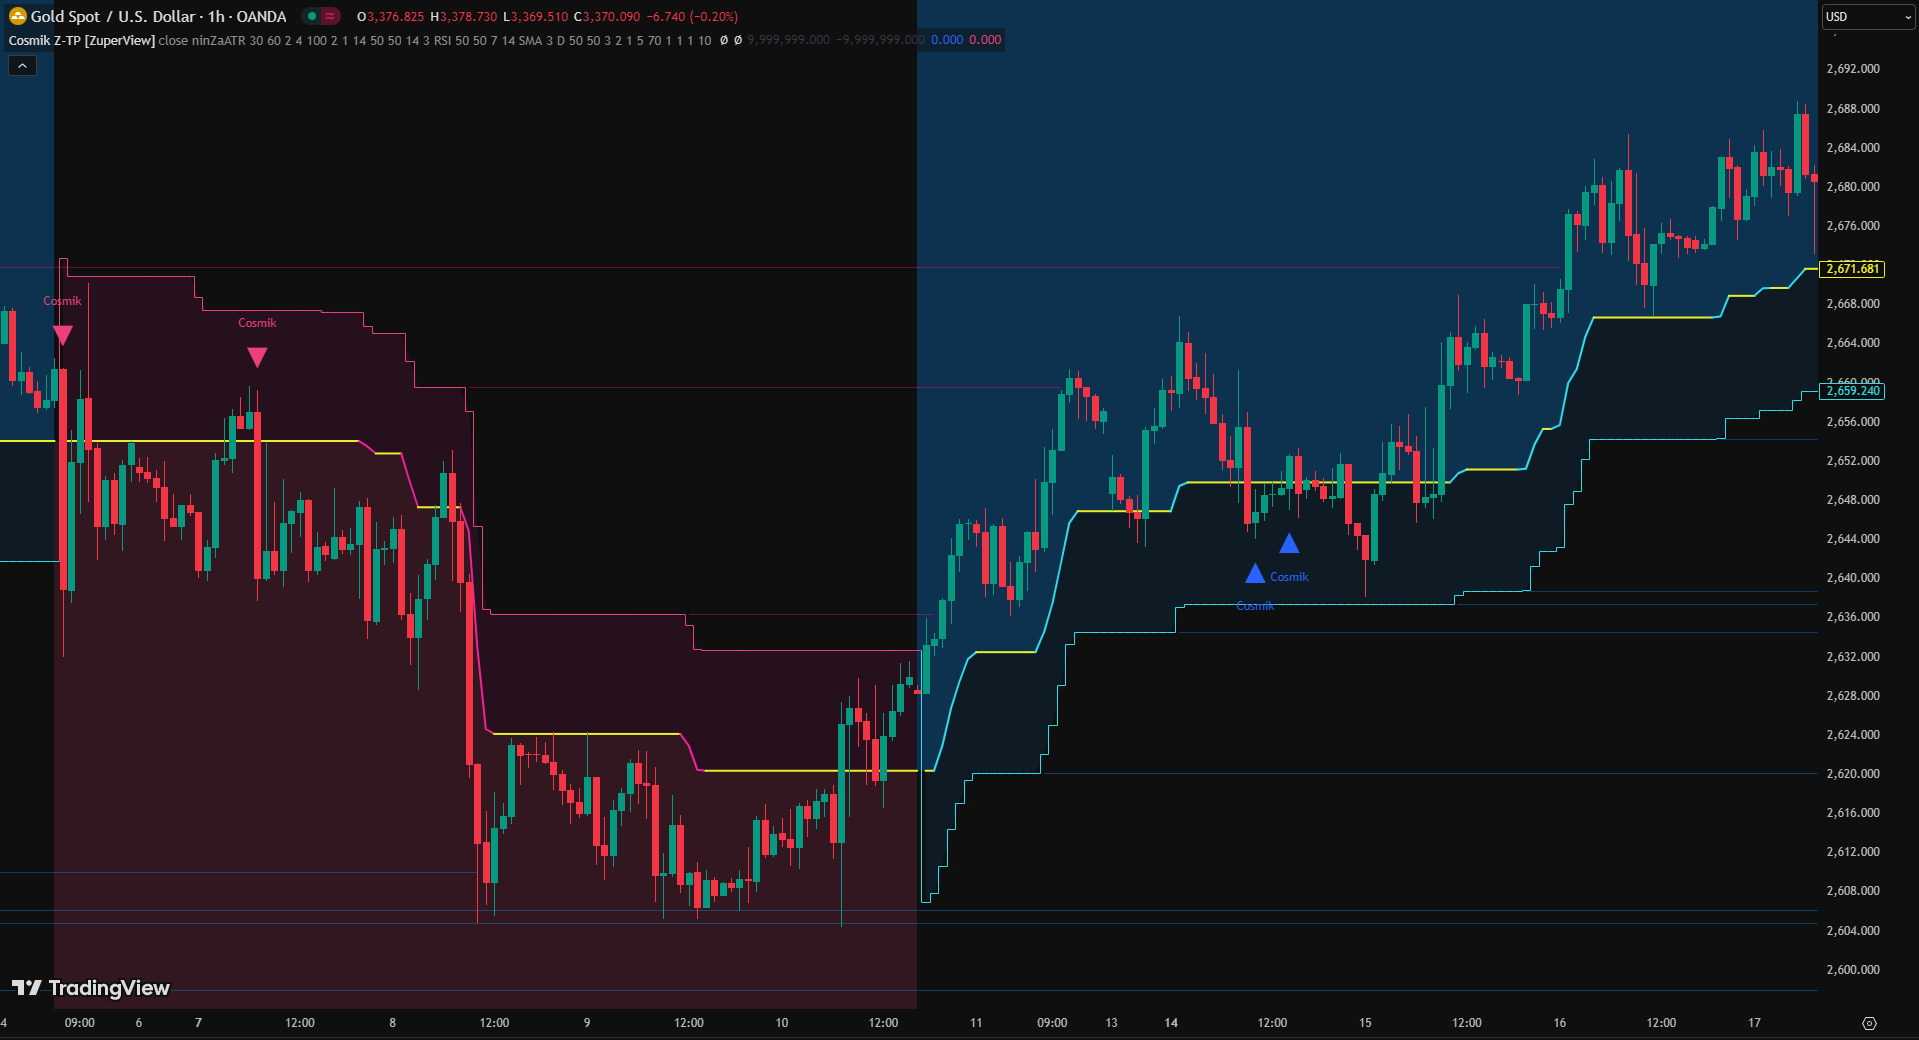
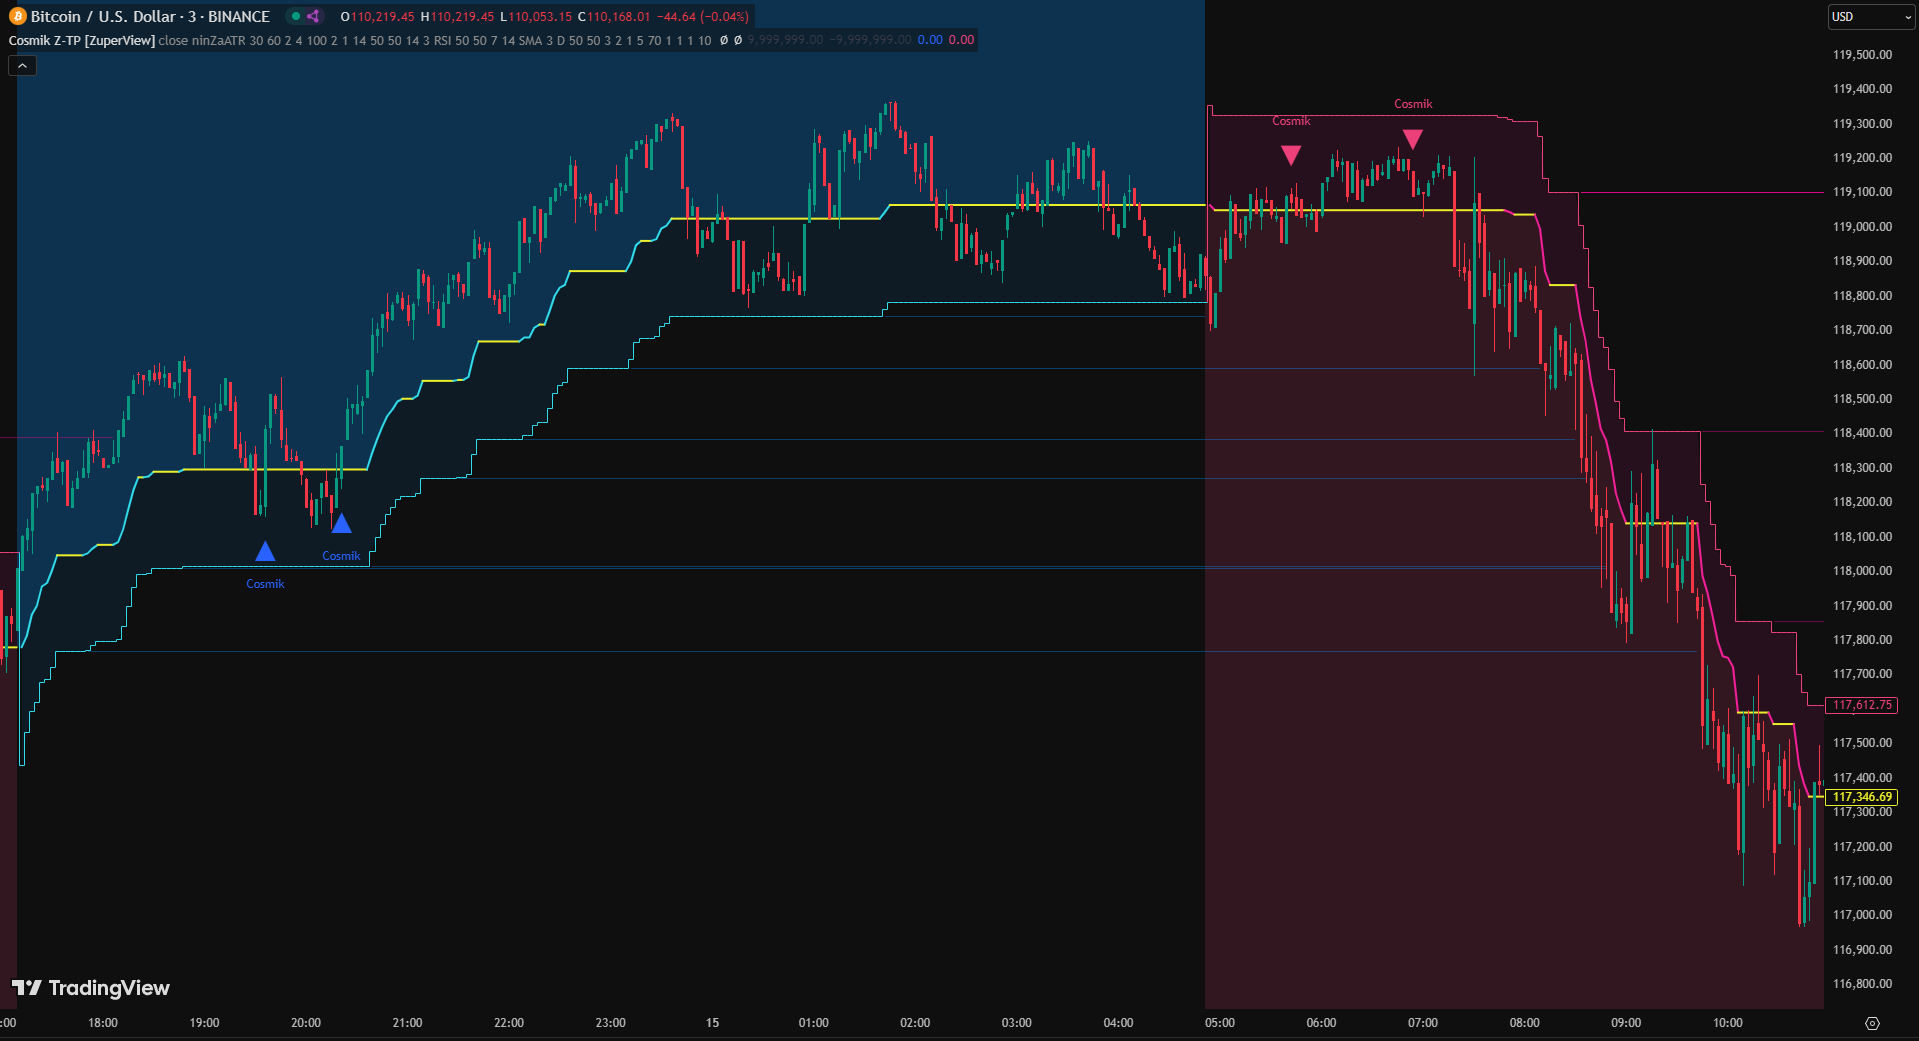
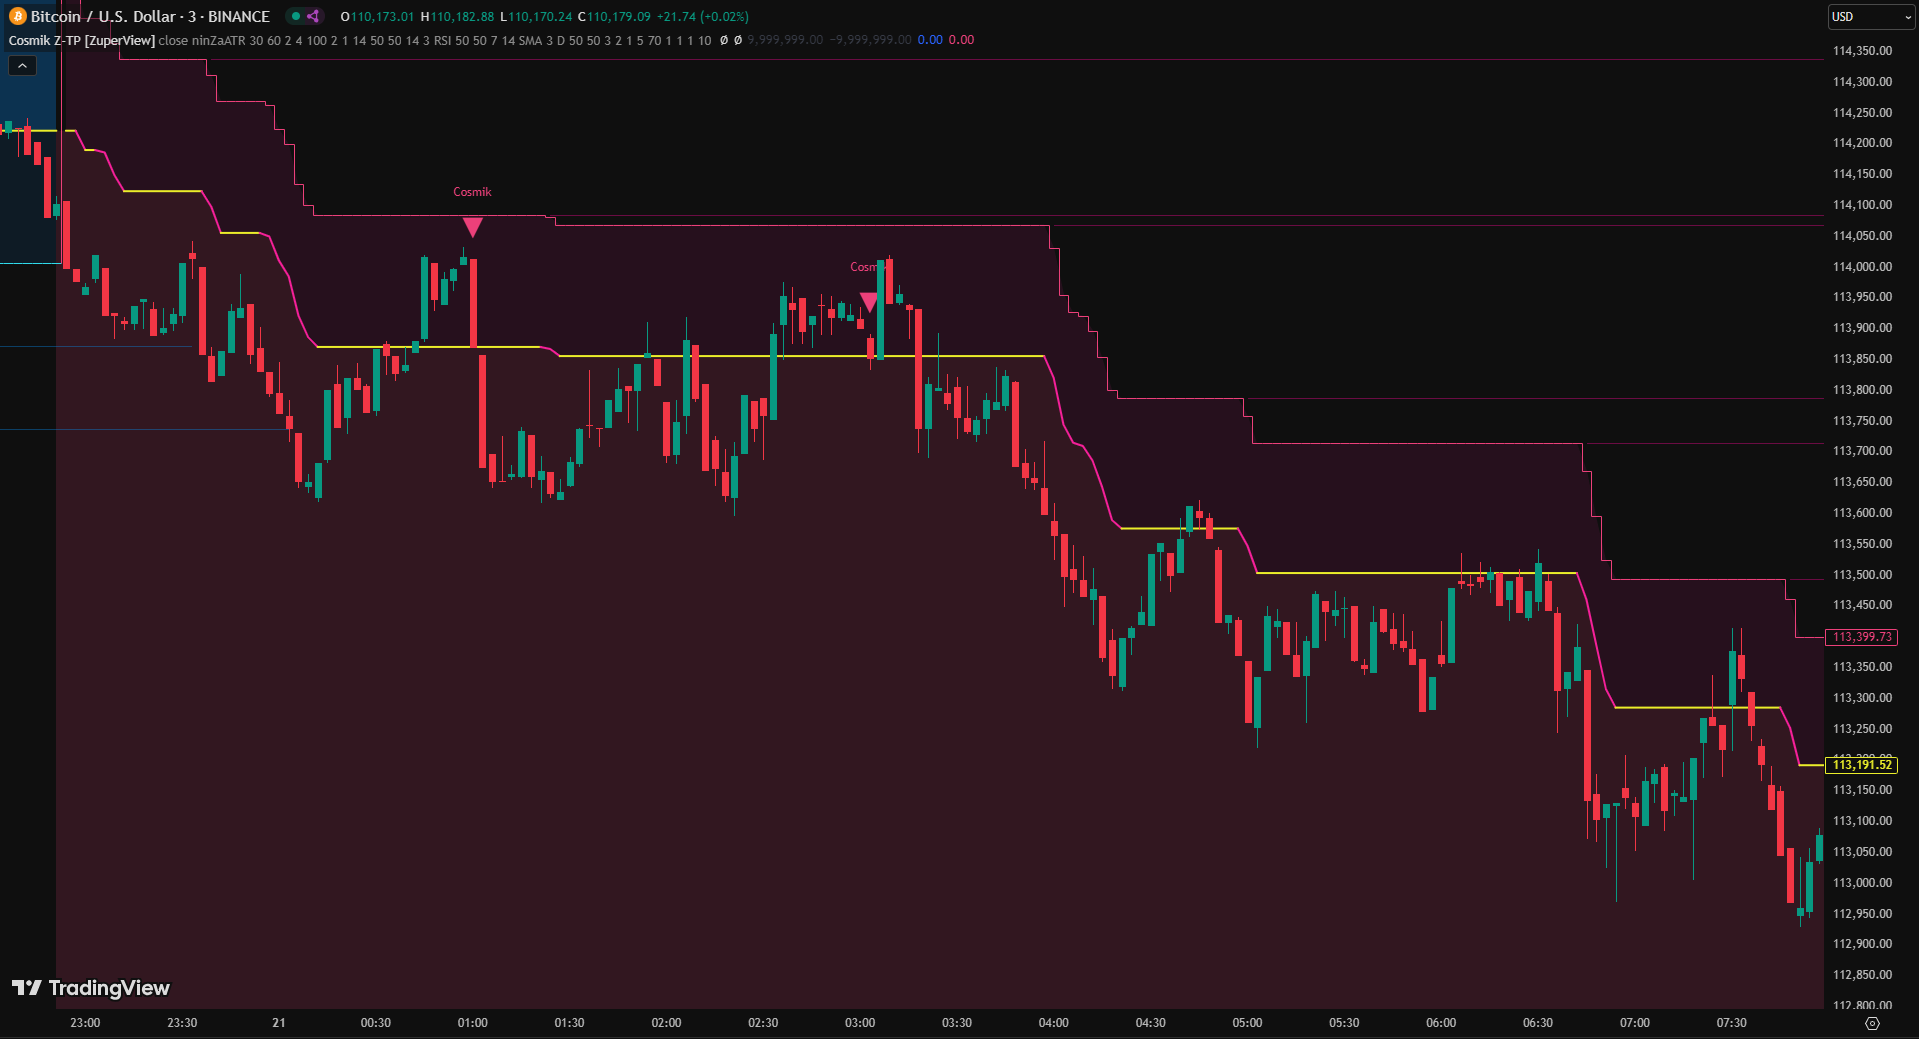
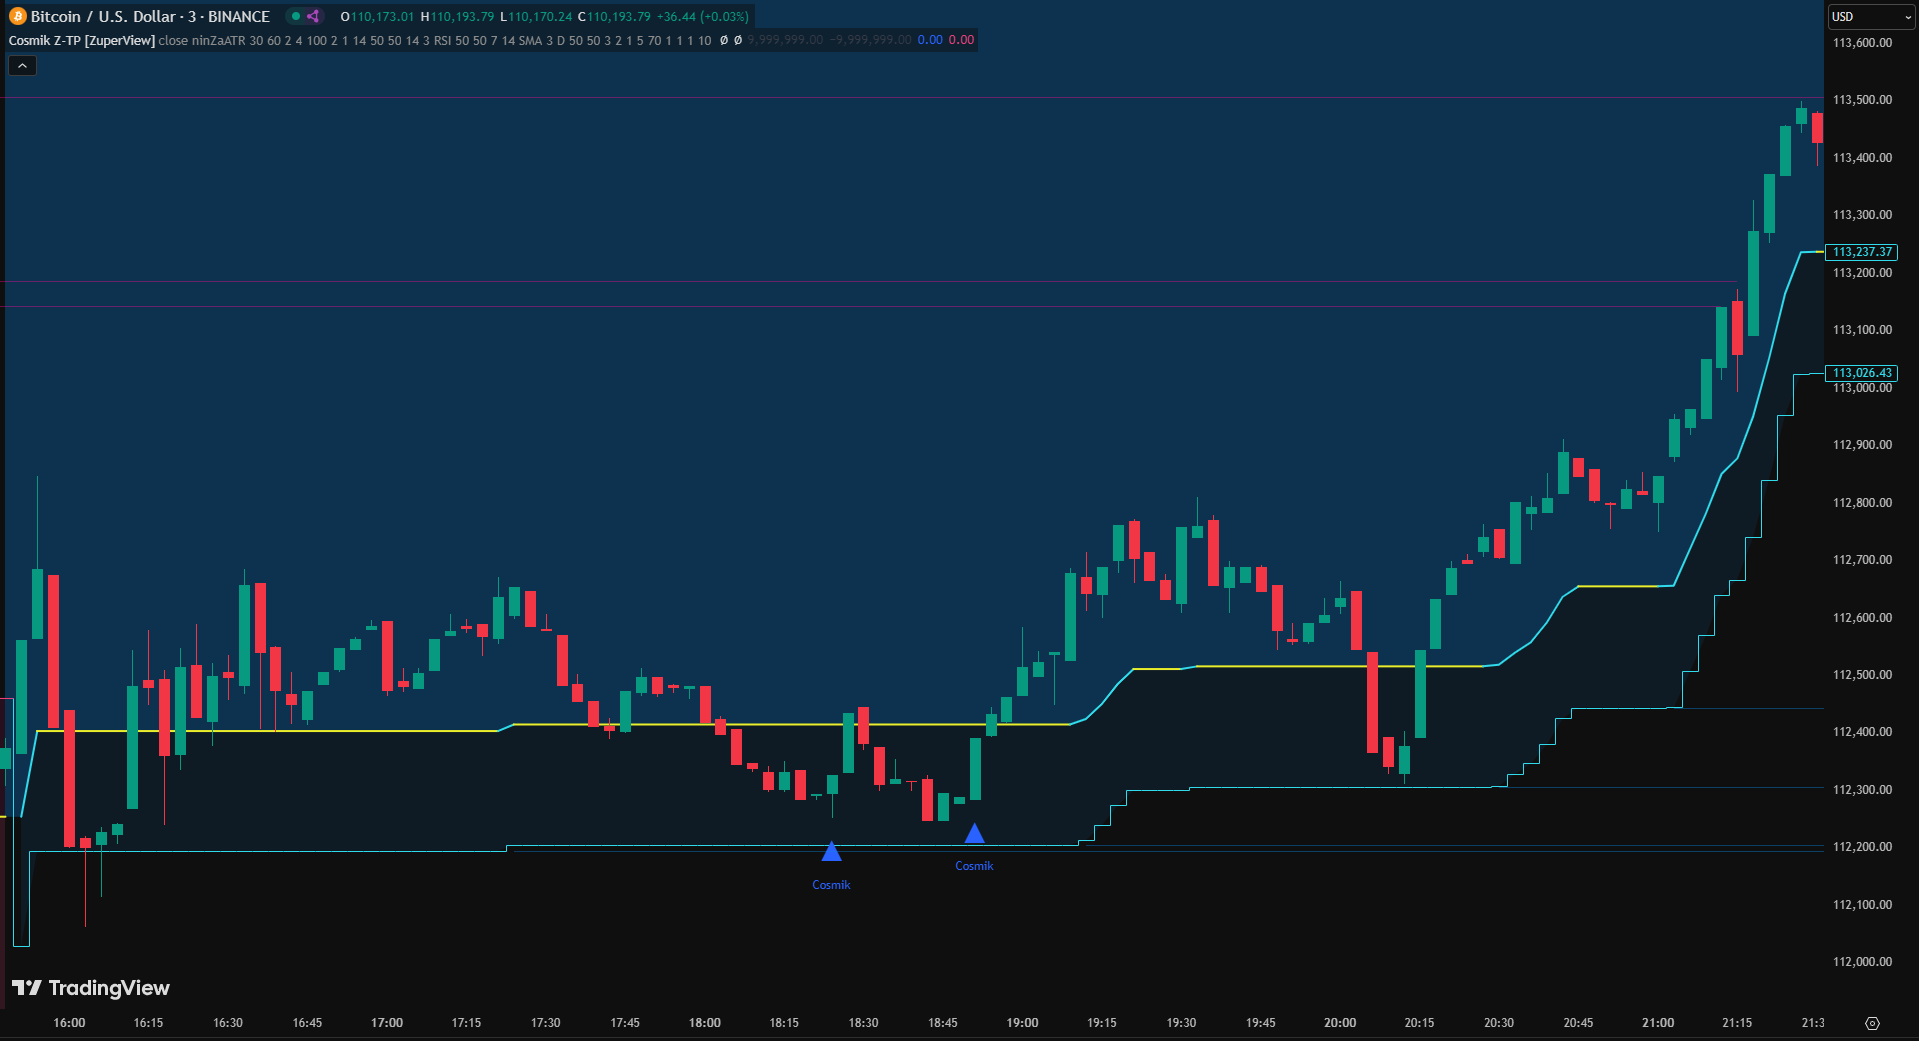
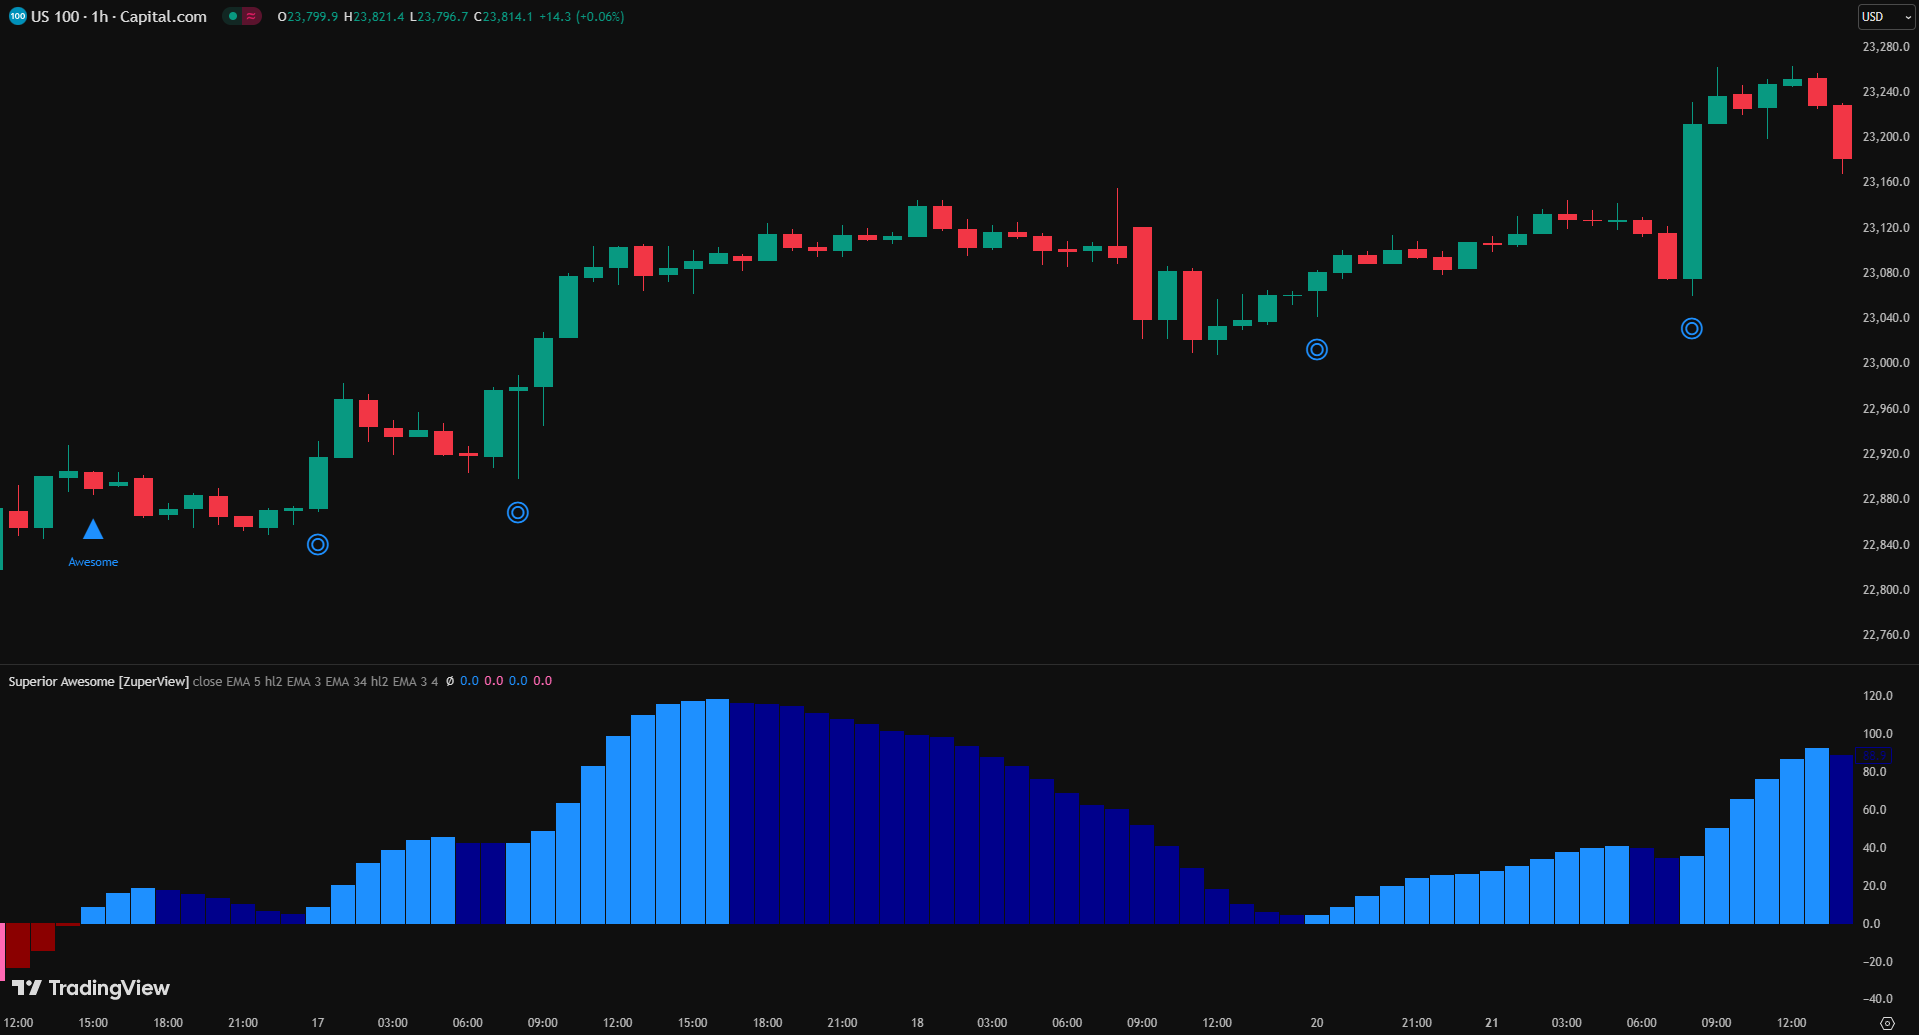
2. Cosmik Z-TP
The Cosmik Z-TP system offers a versatile framework by integrating trend detection, signal zones, and entry points in a single tool. Its dynamic support and resistance levels help define stop-loss and take-profit areas, while its flexibility allows it to adapt to different bar types and trading styles, including scalping, day trading, or swing trading. You can quickly identify the “sweet spot” for entries, minimizing guesswork and improving trade management.

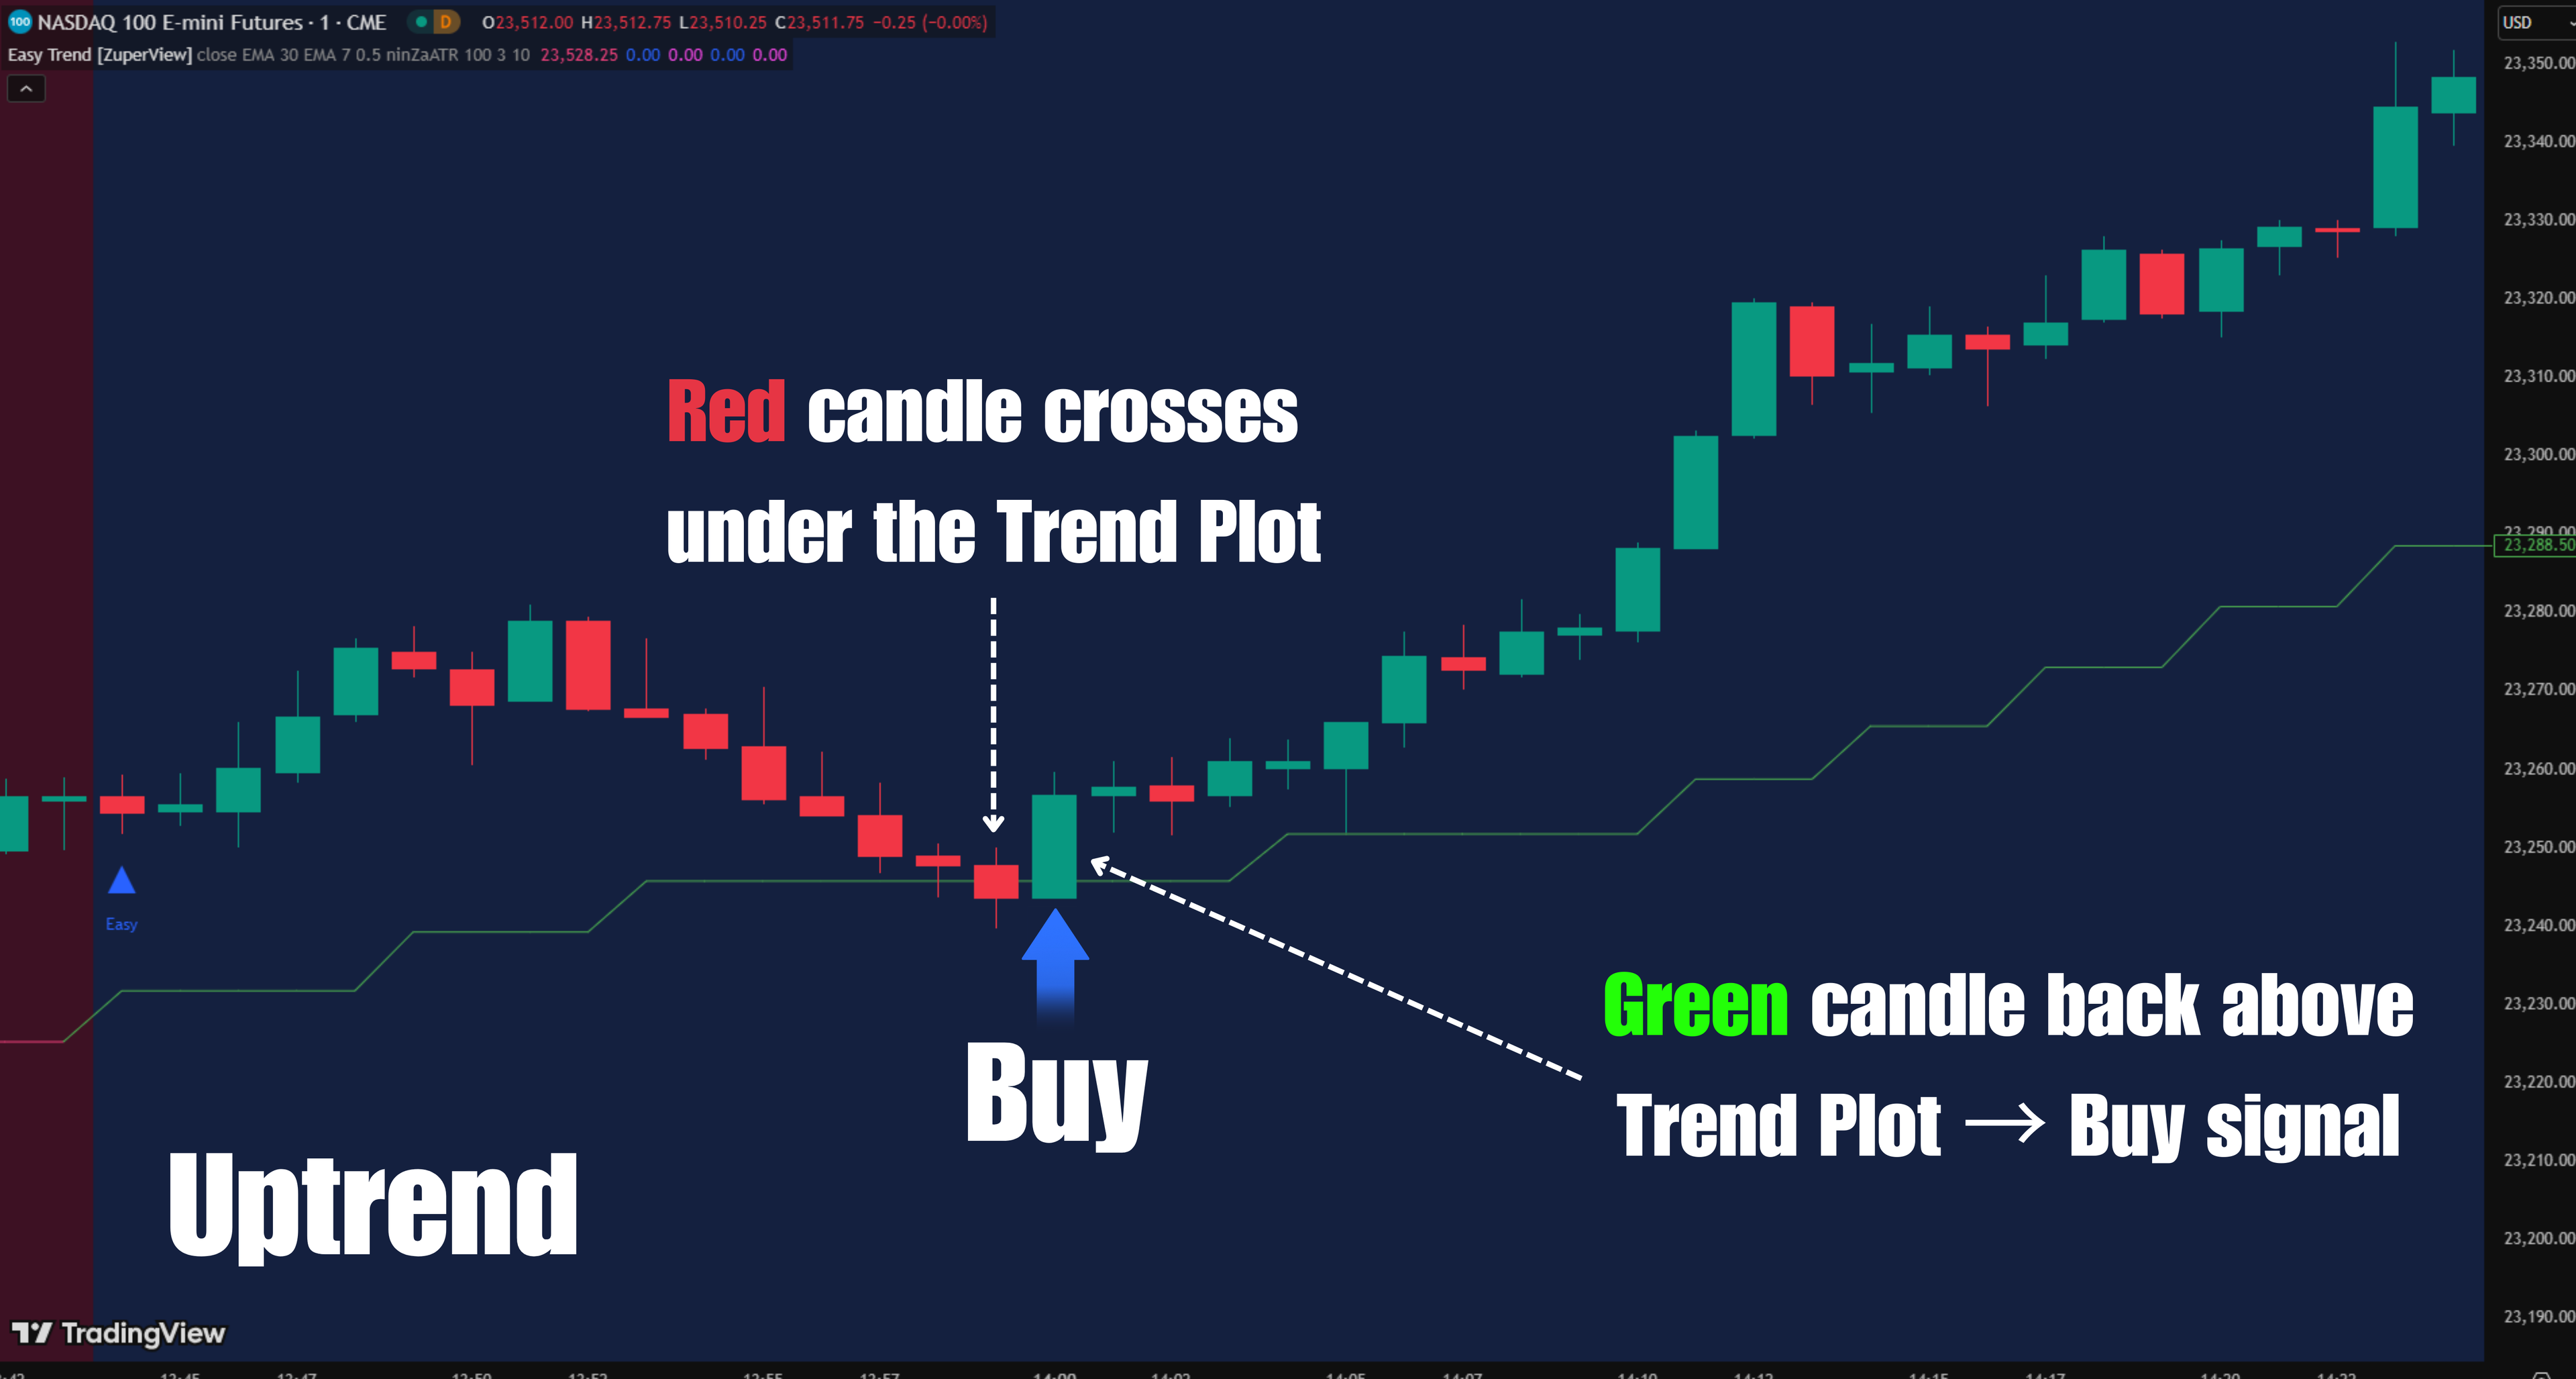
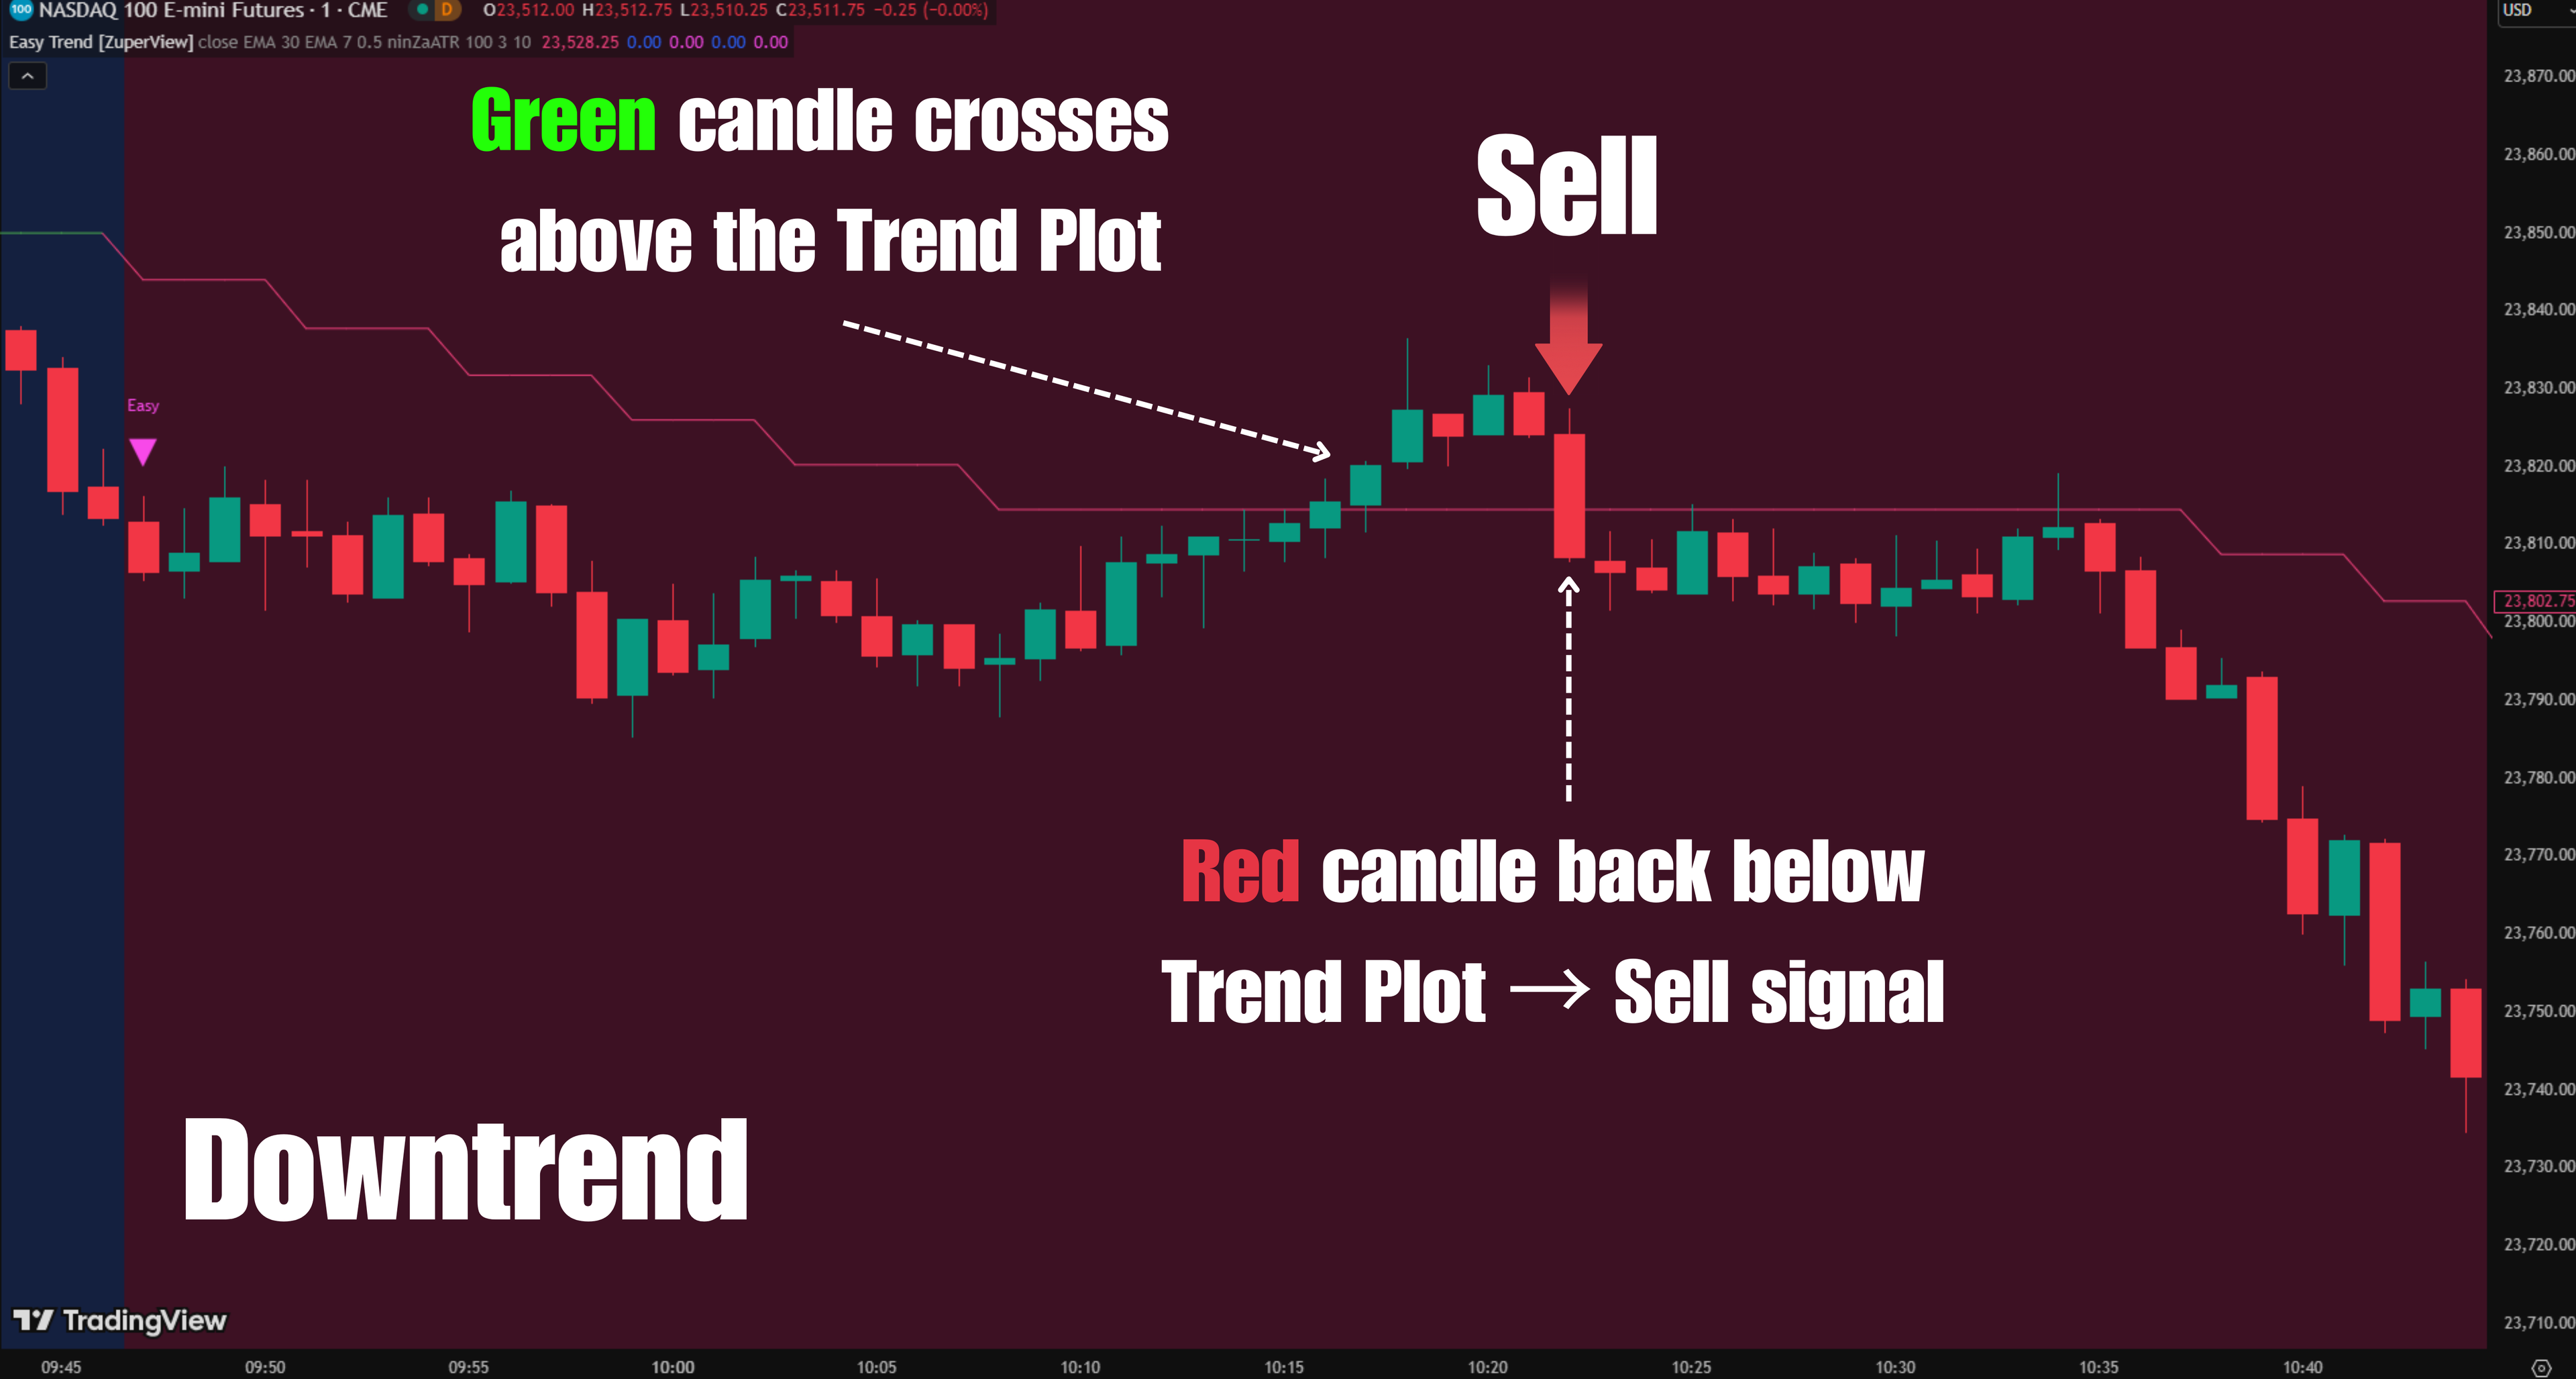
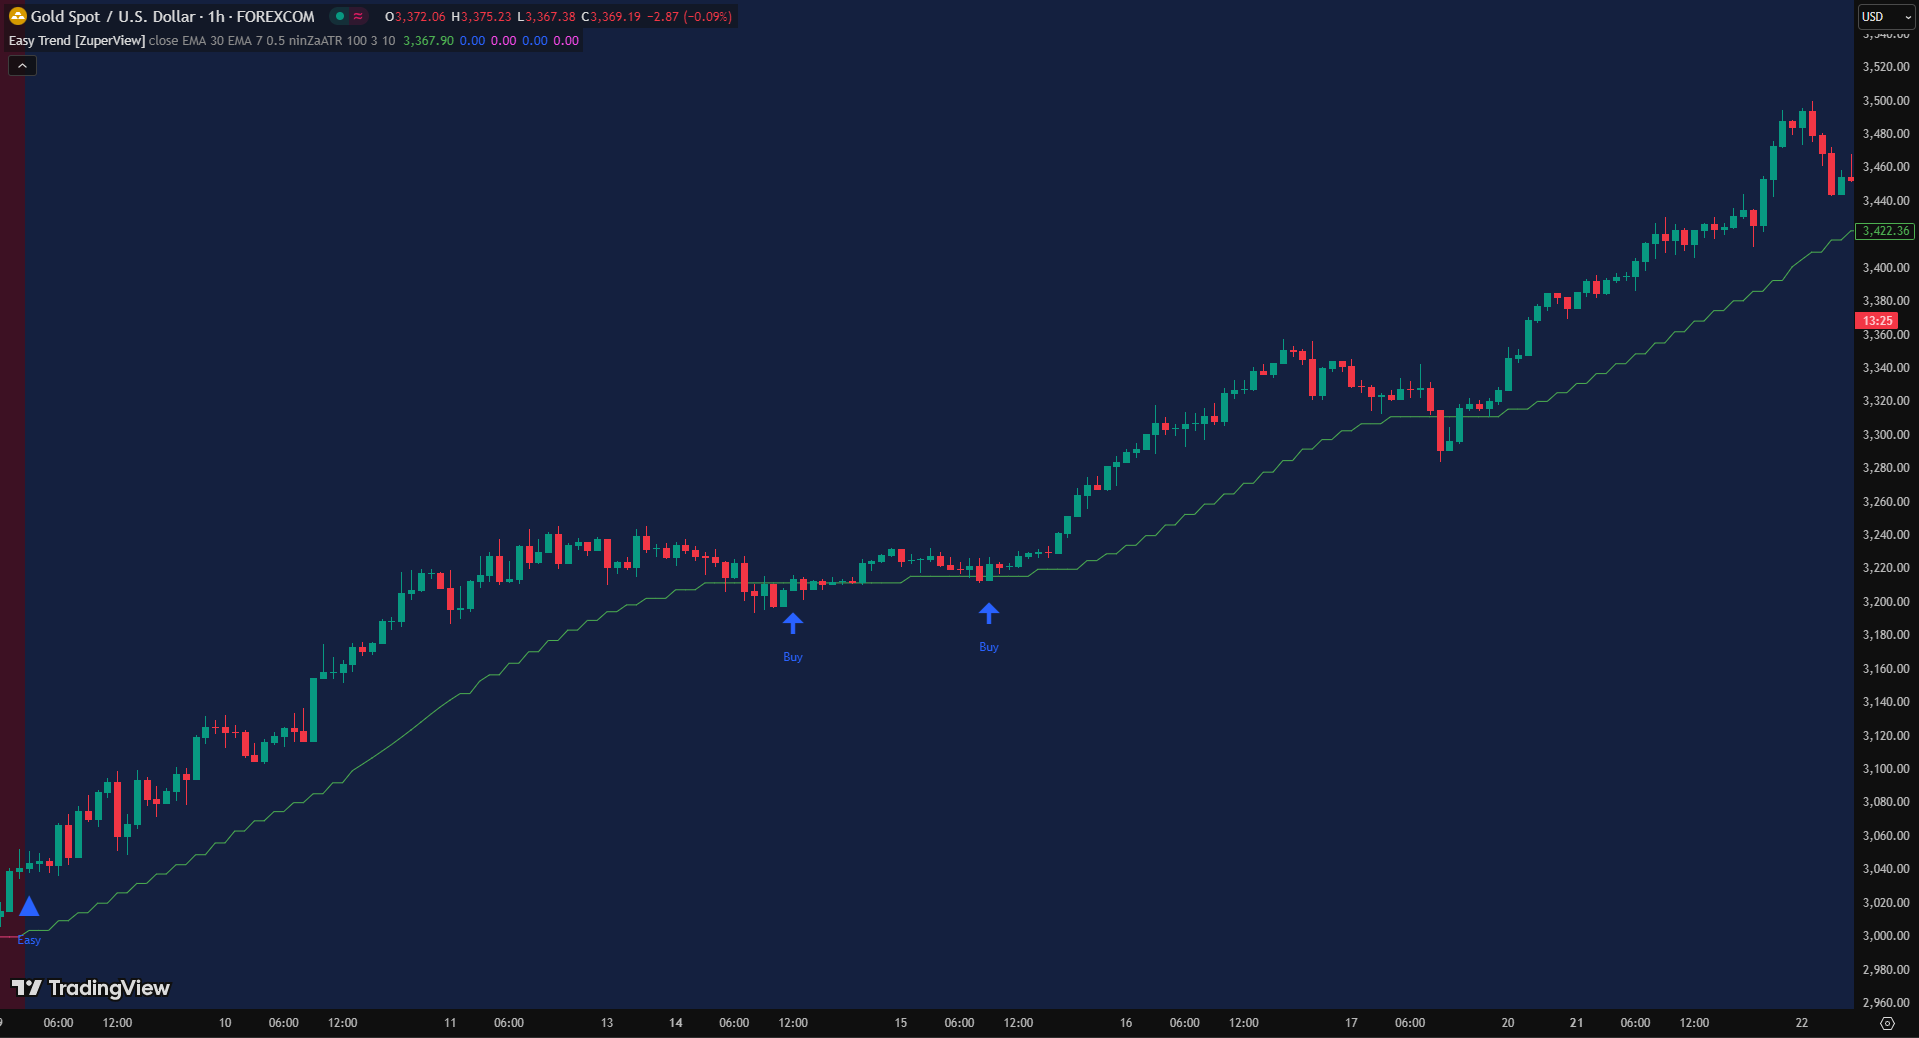
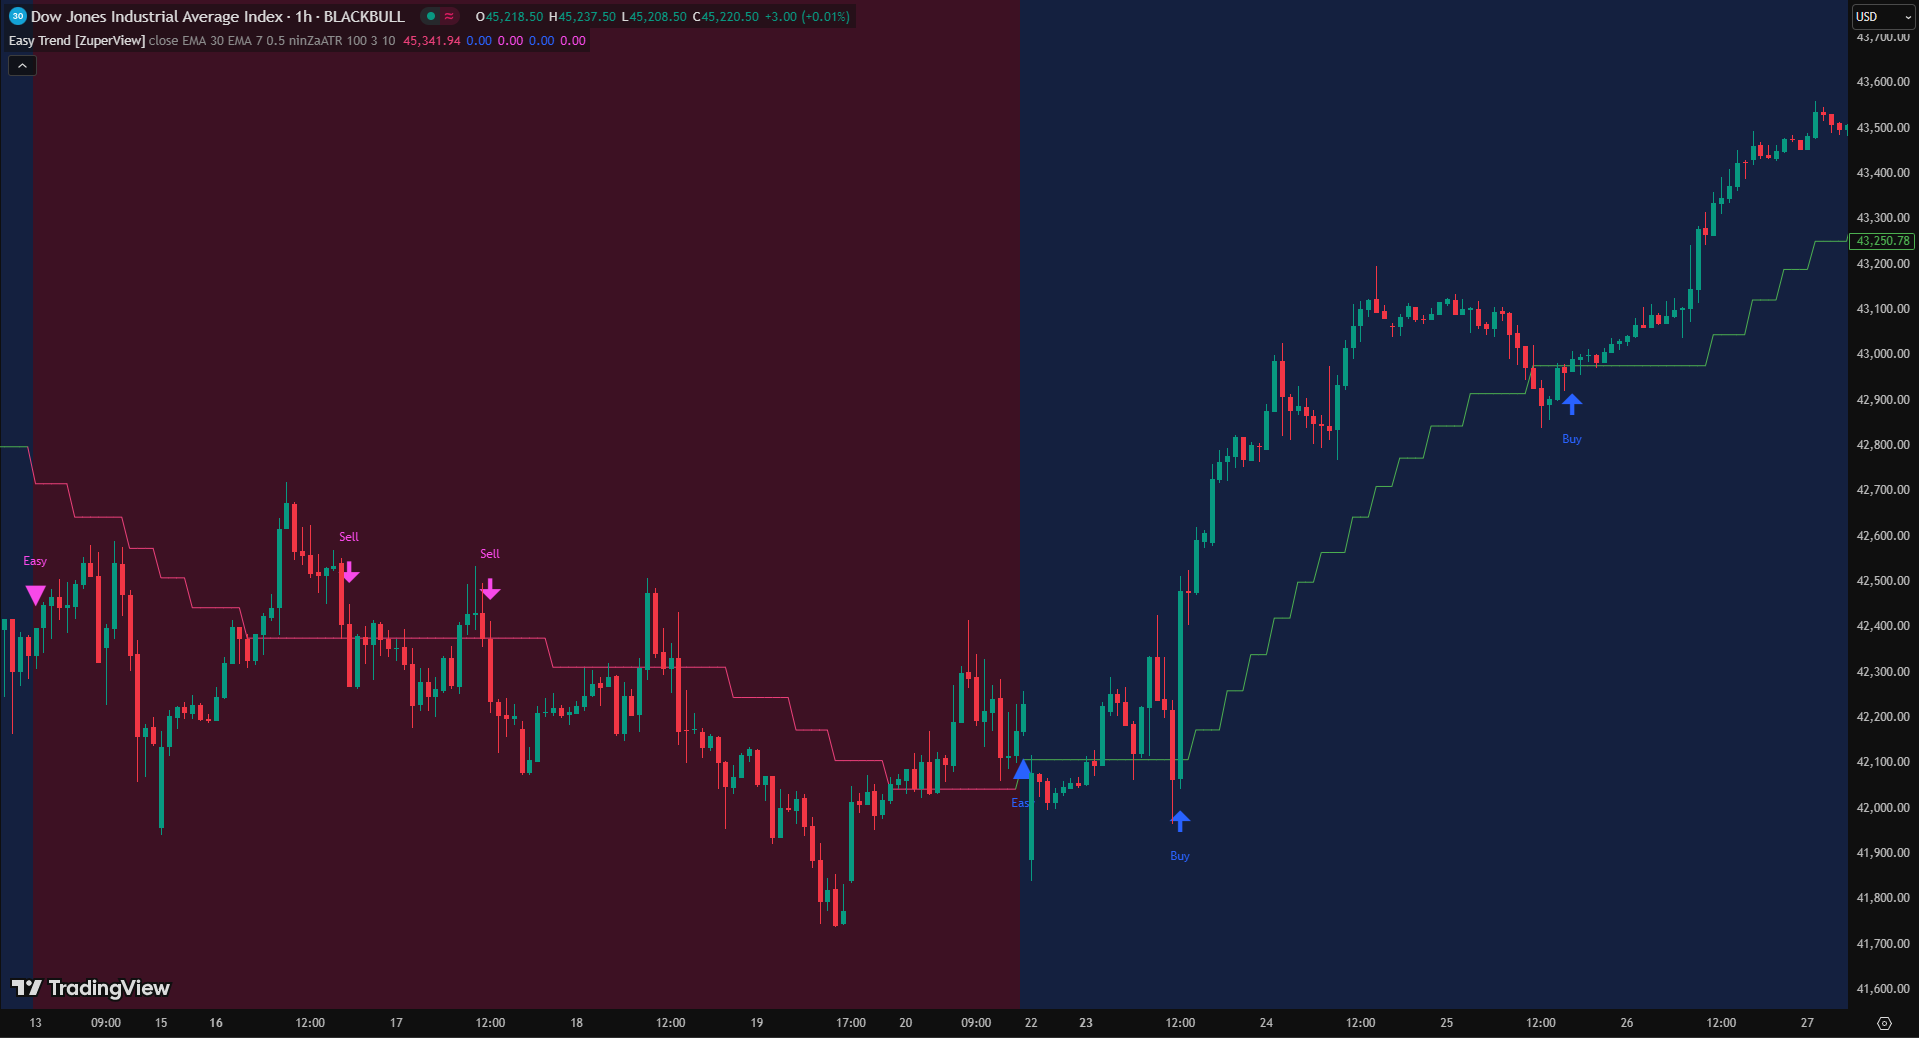
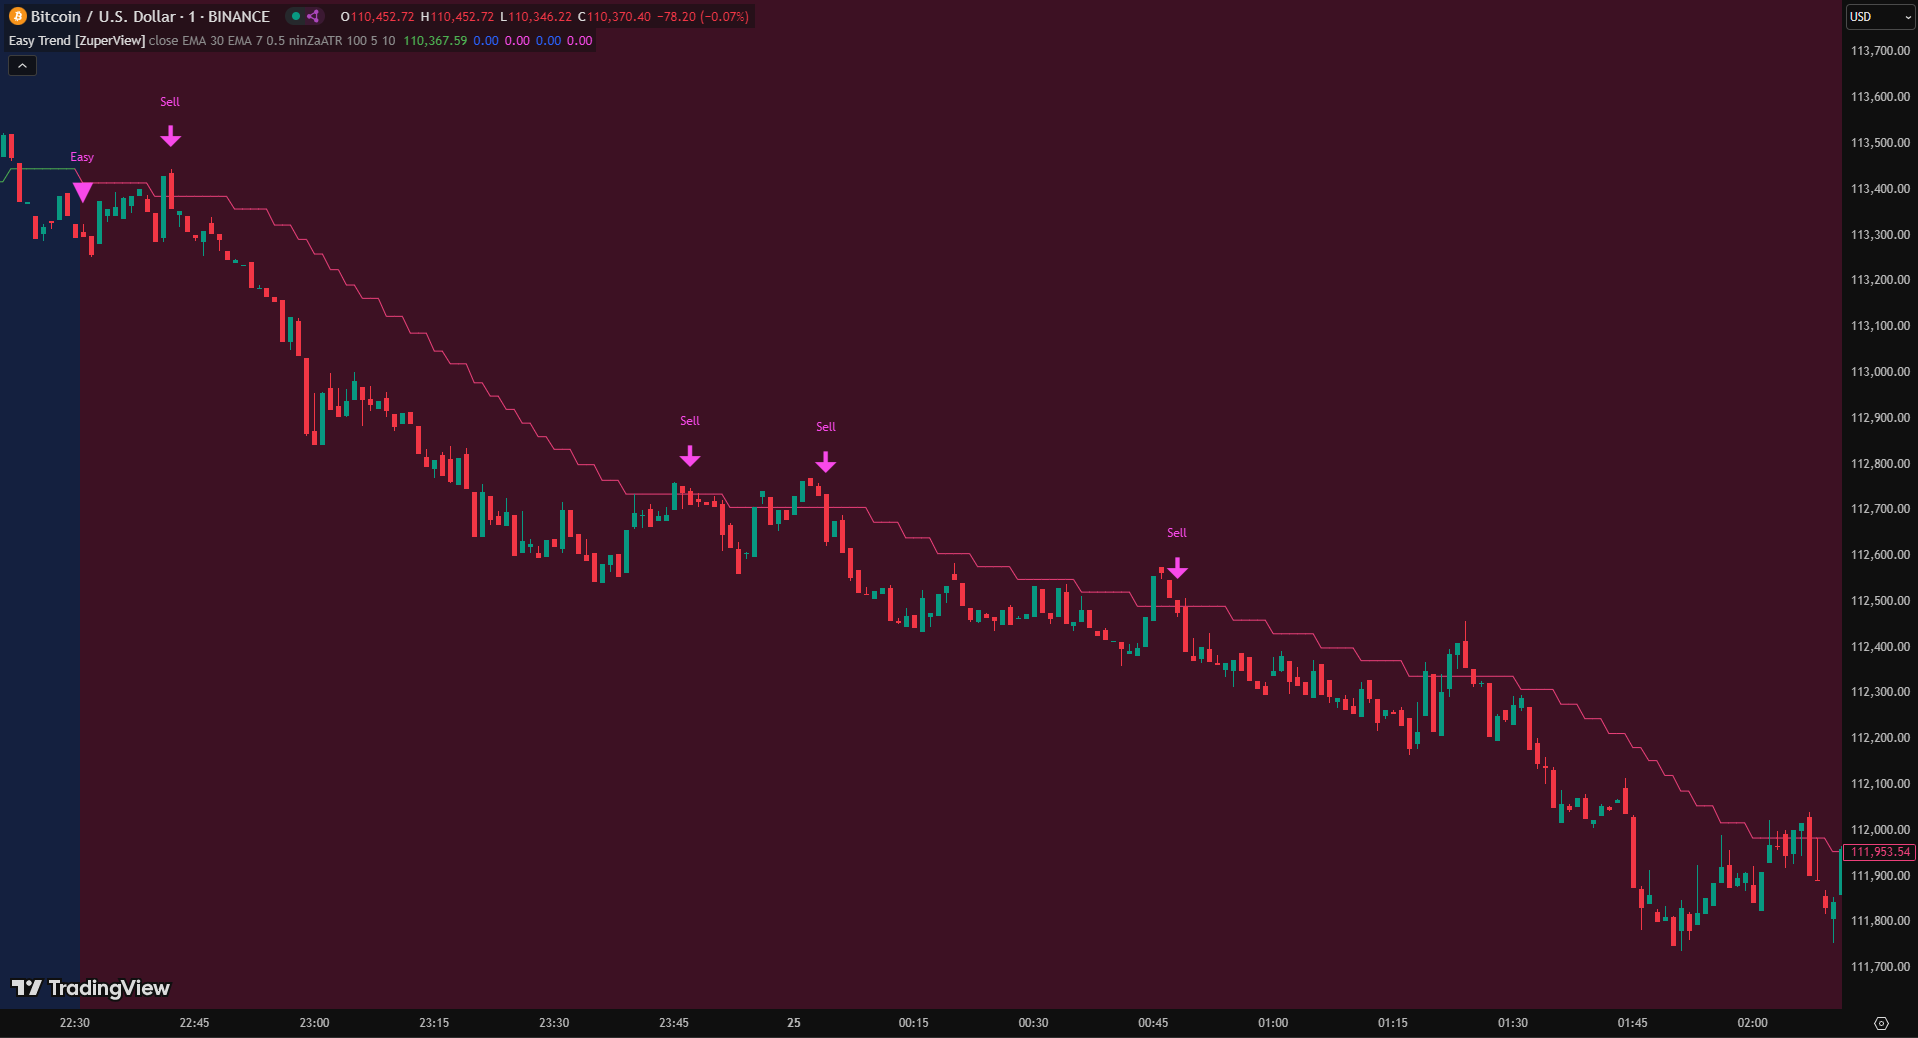
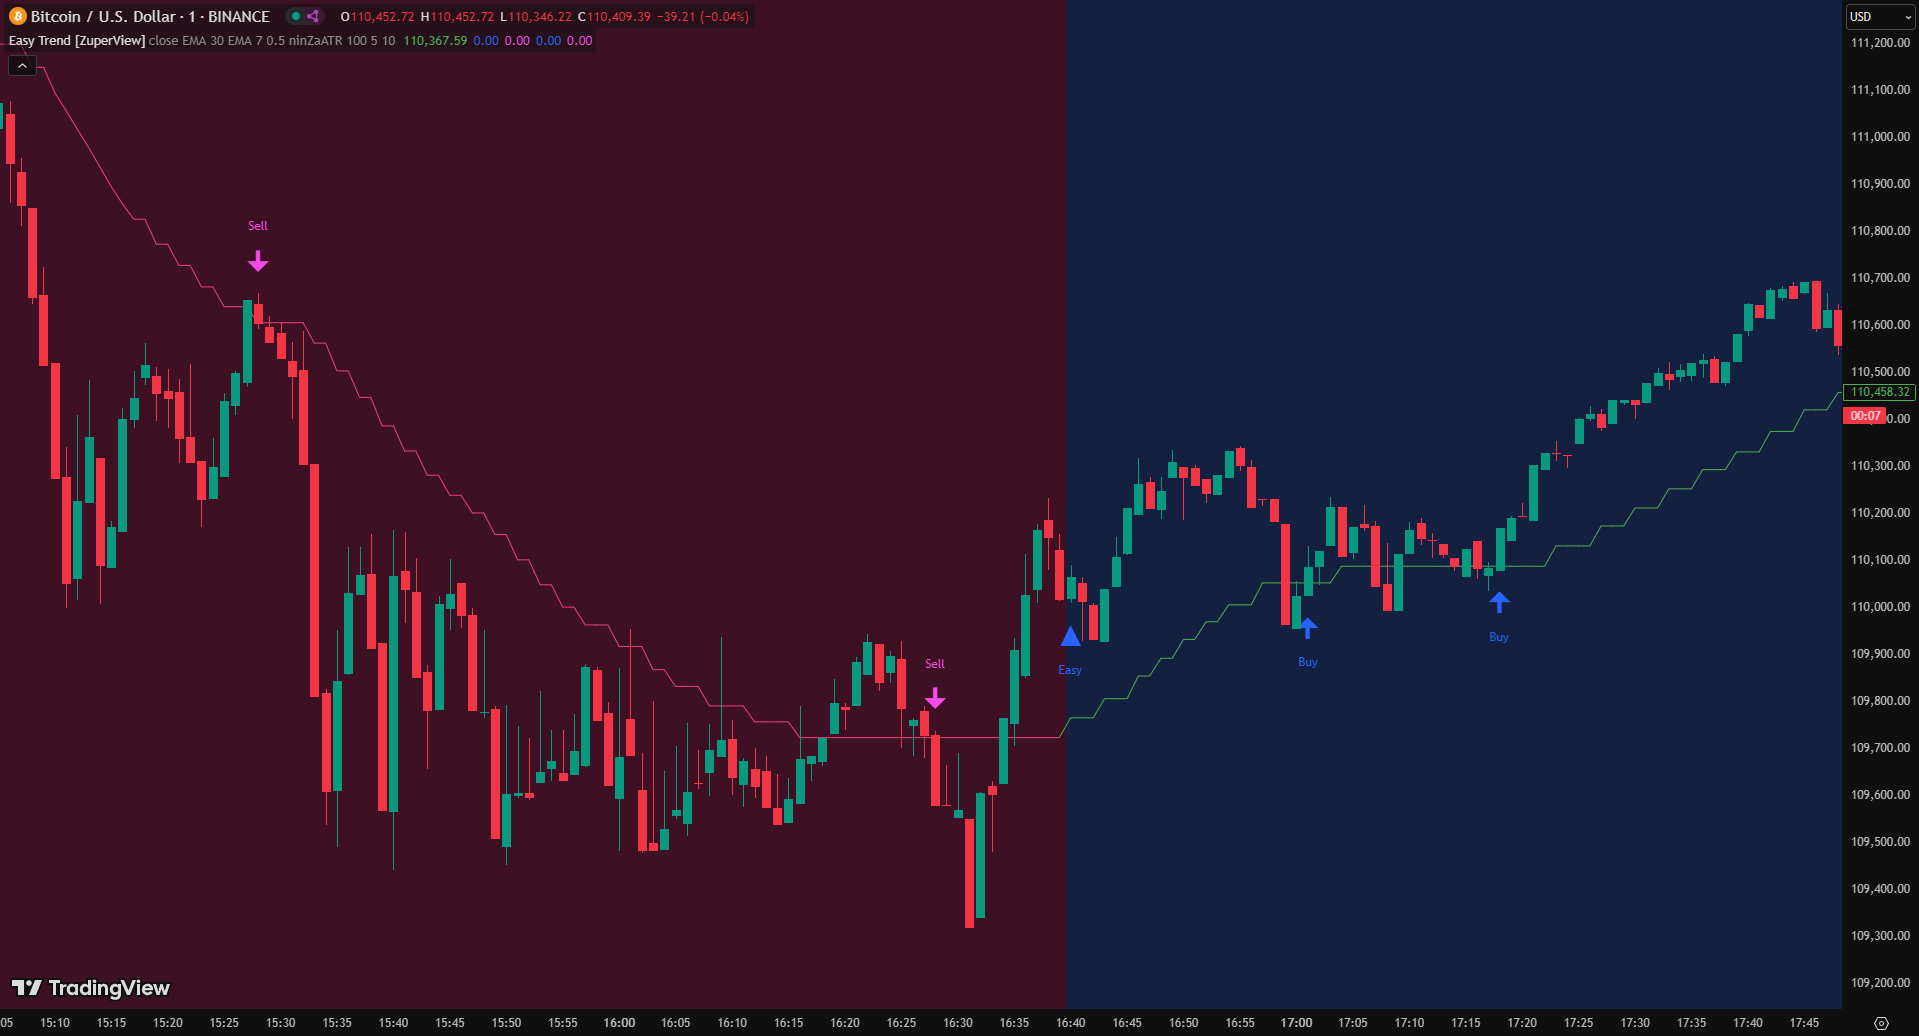
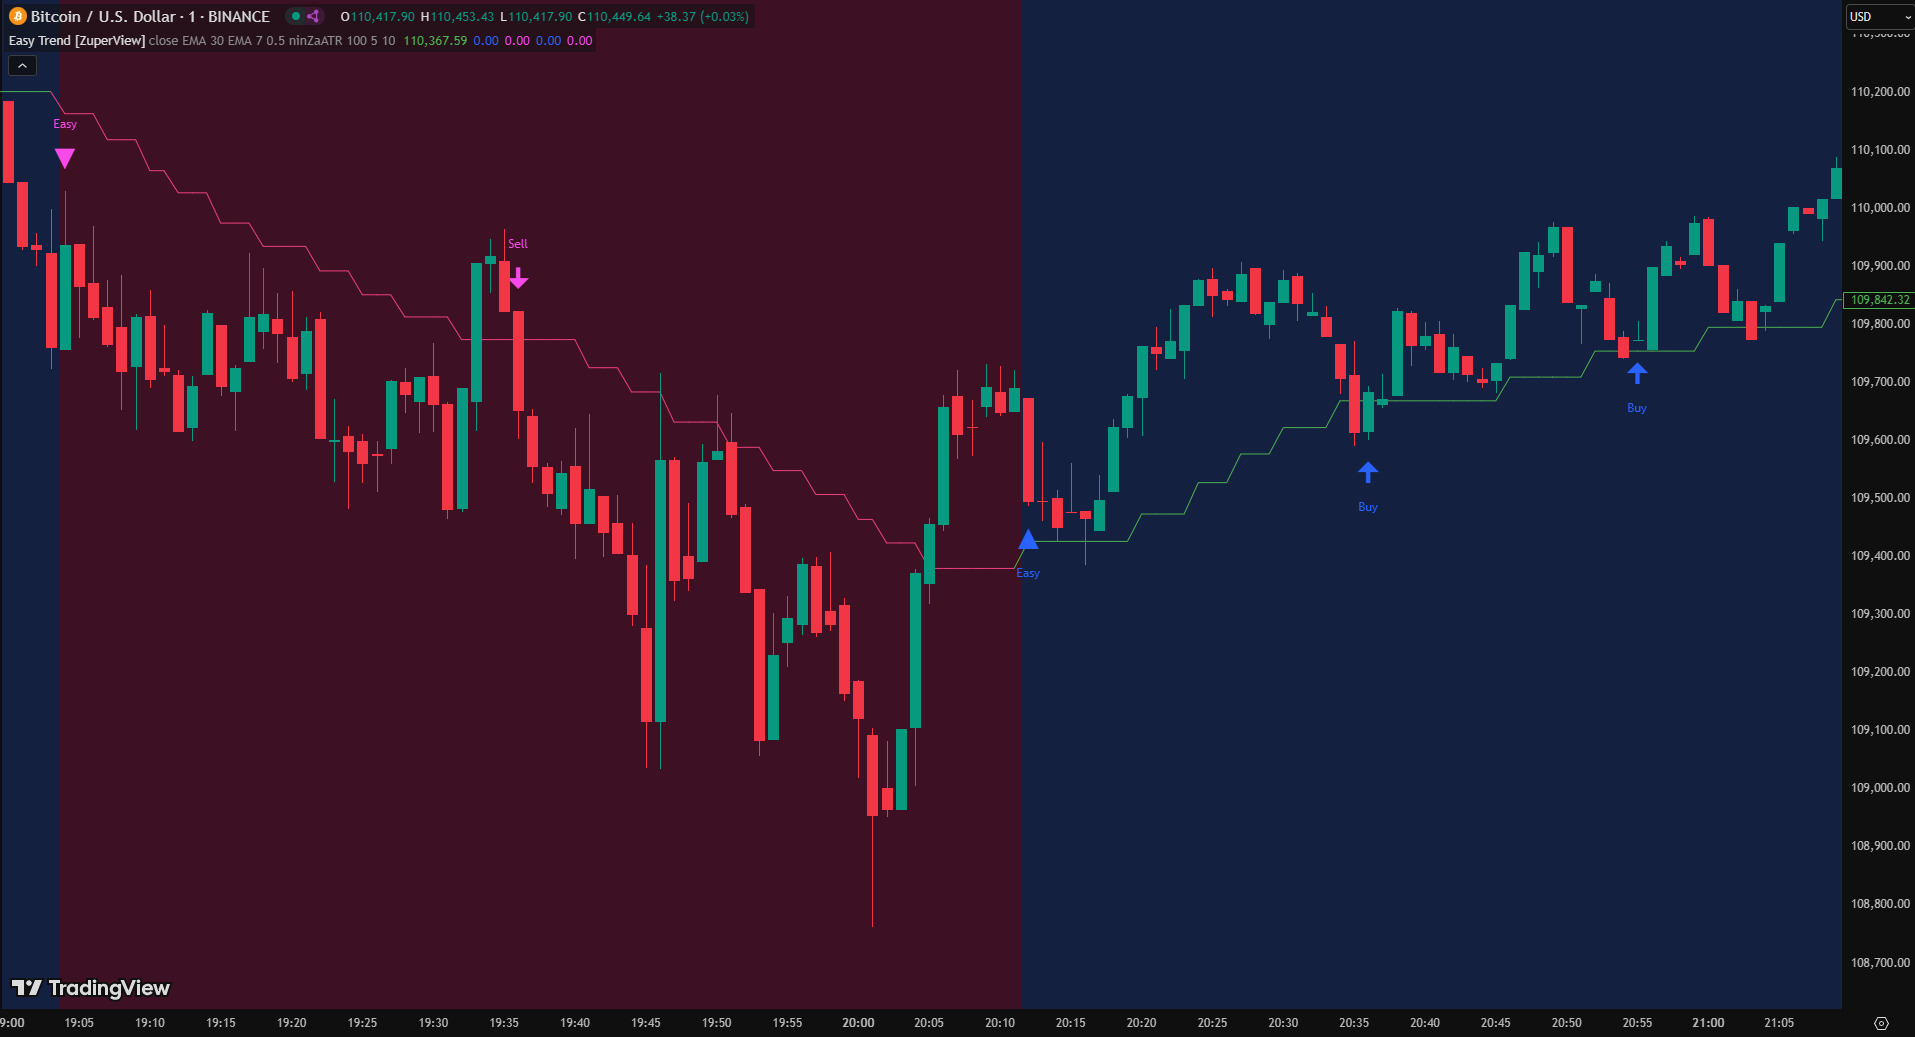
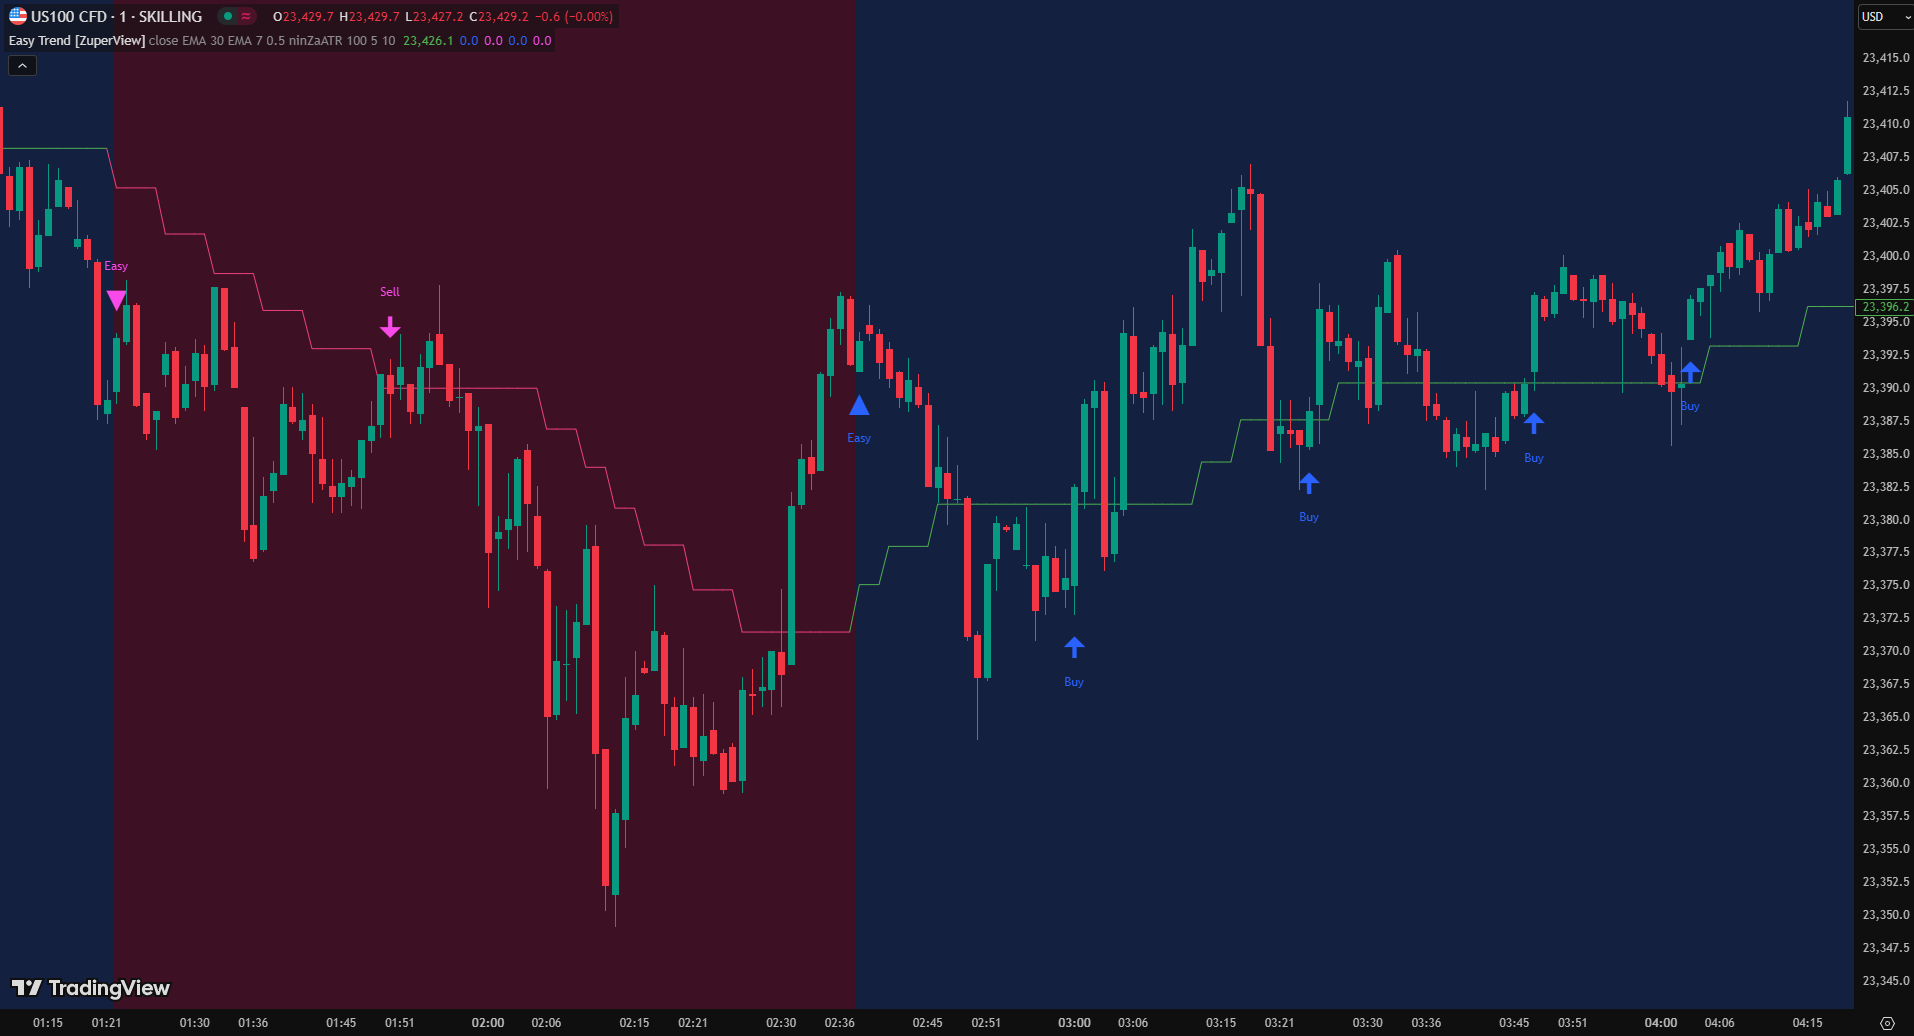
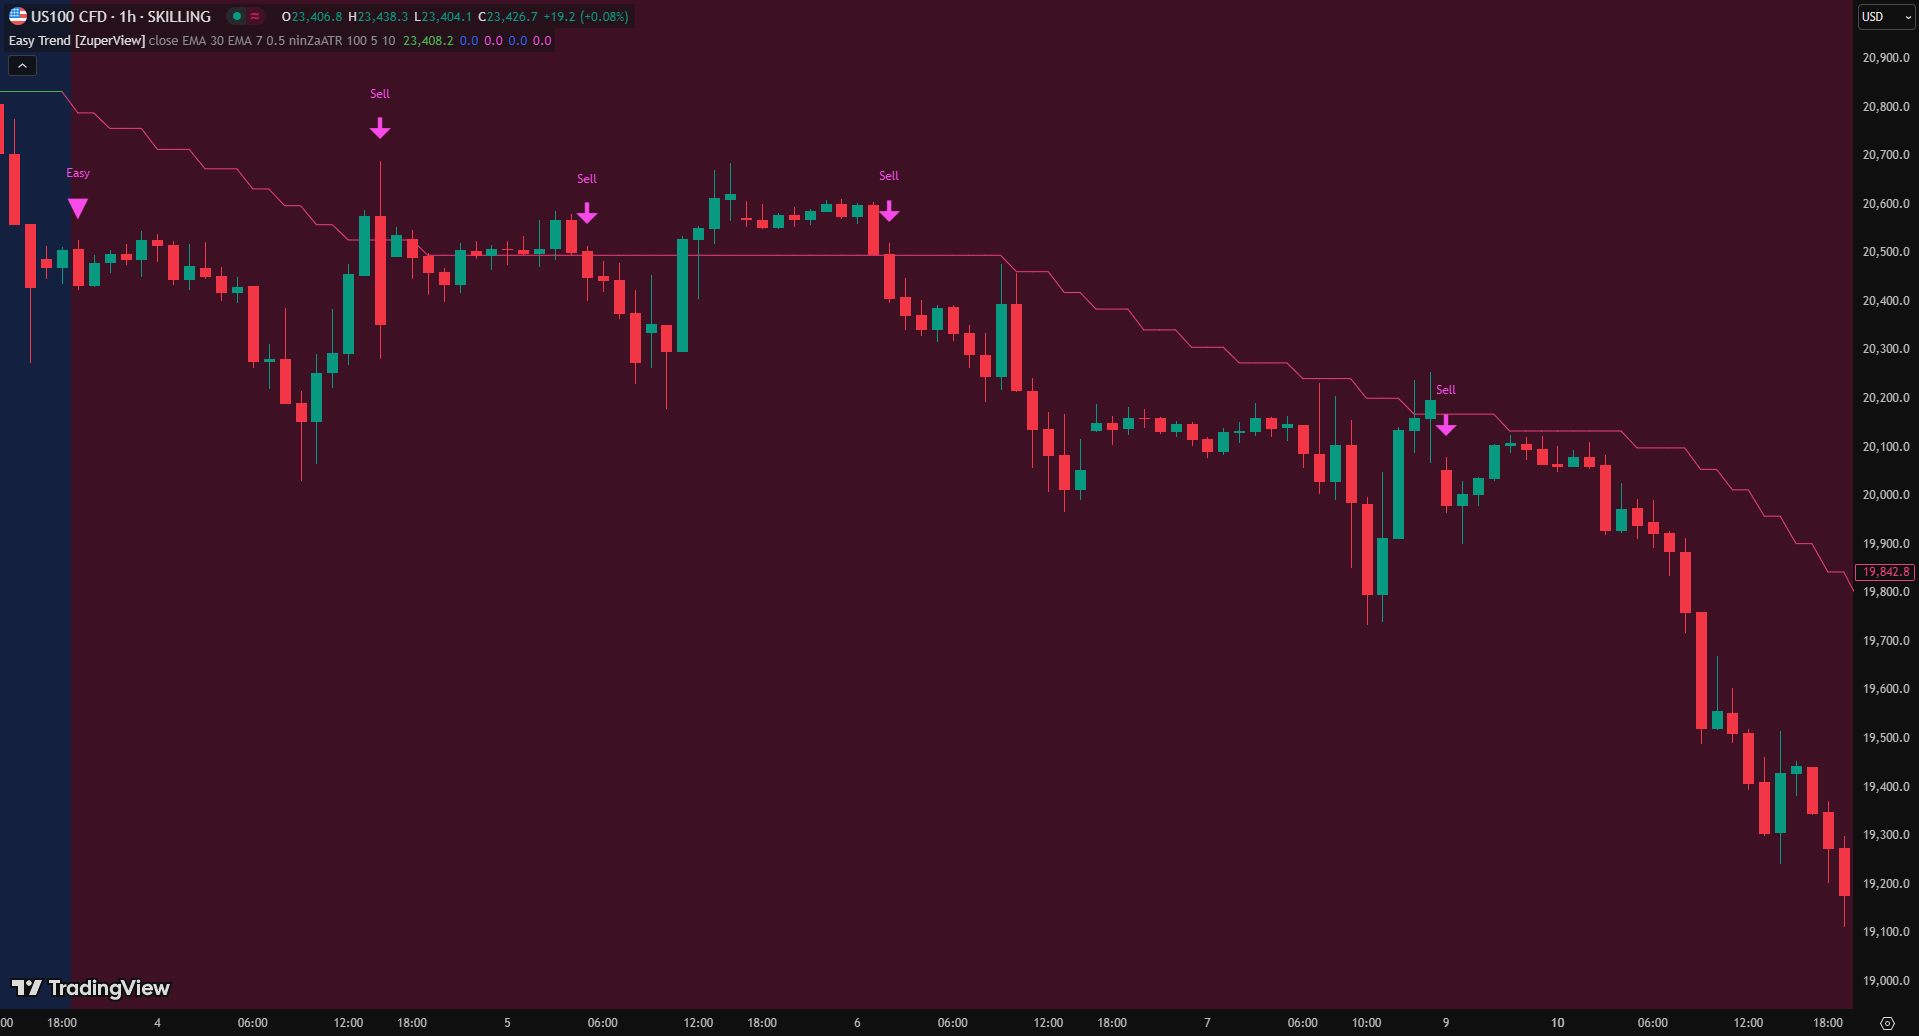
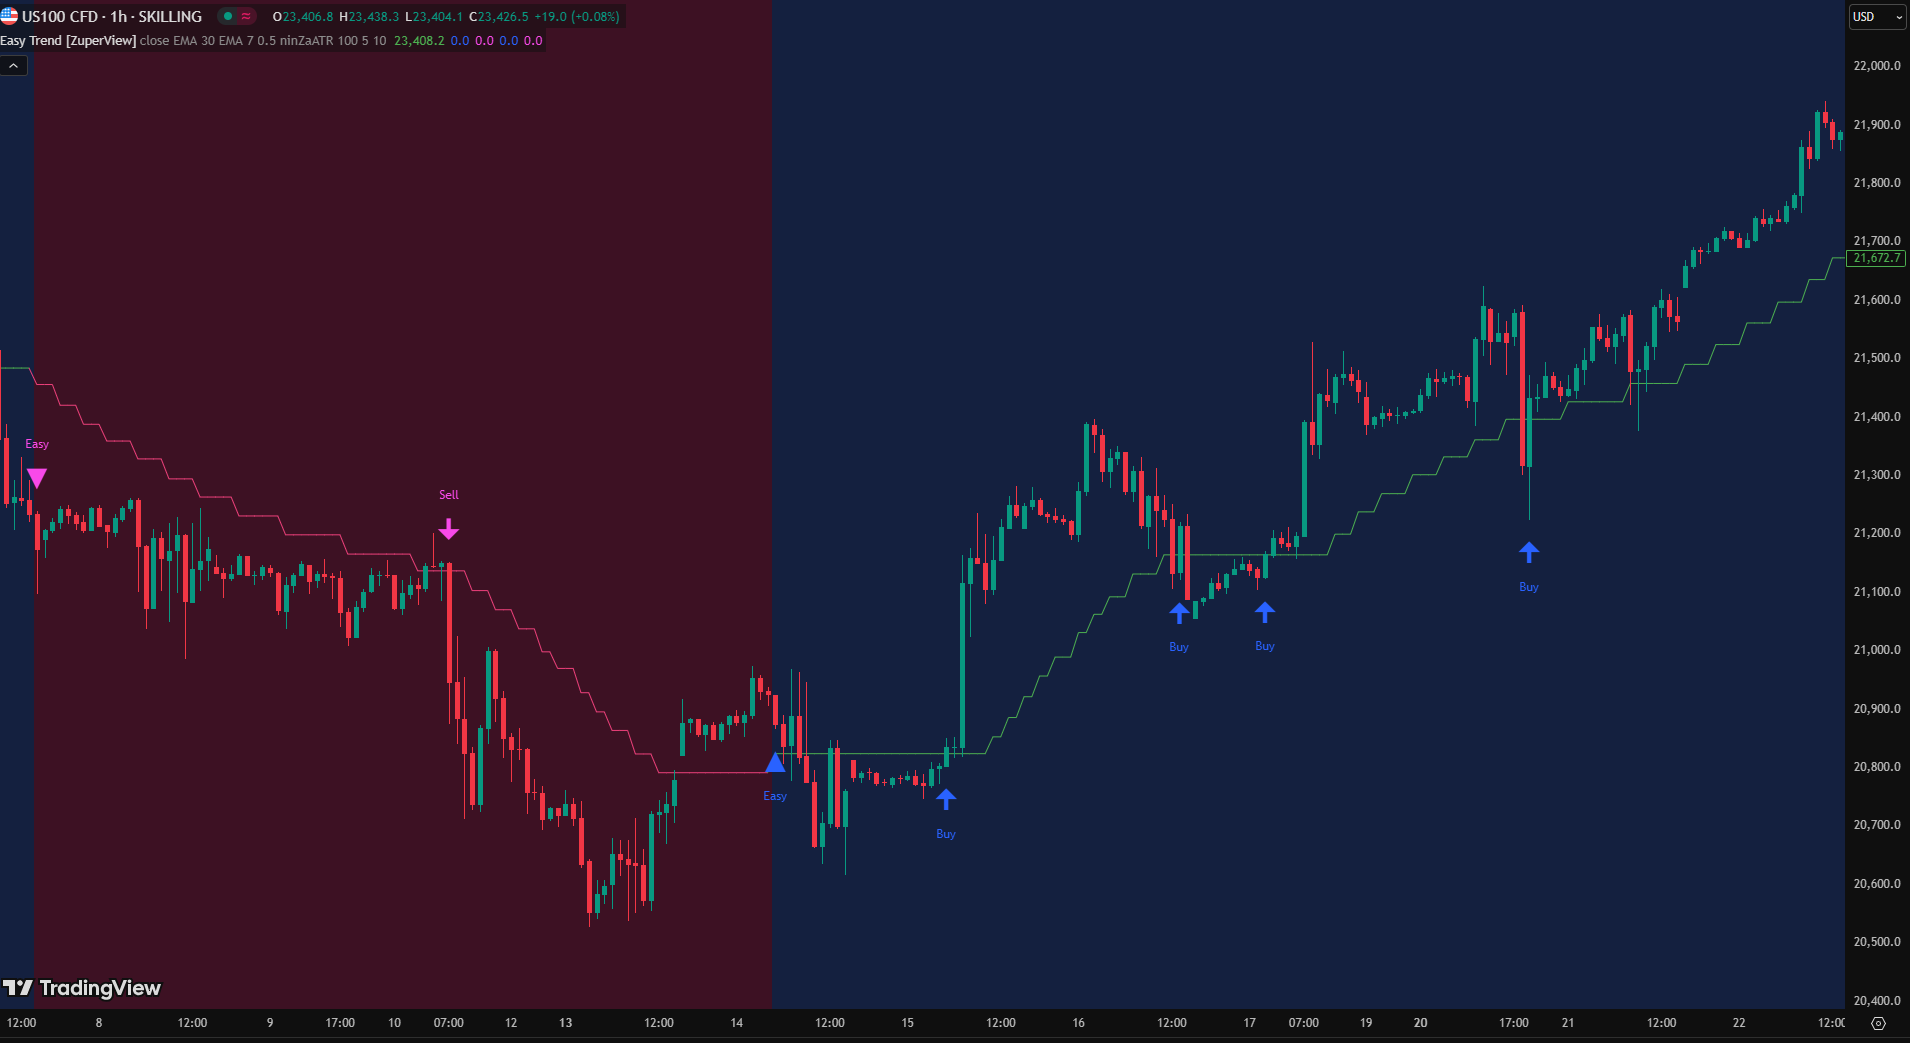
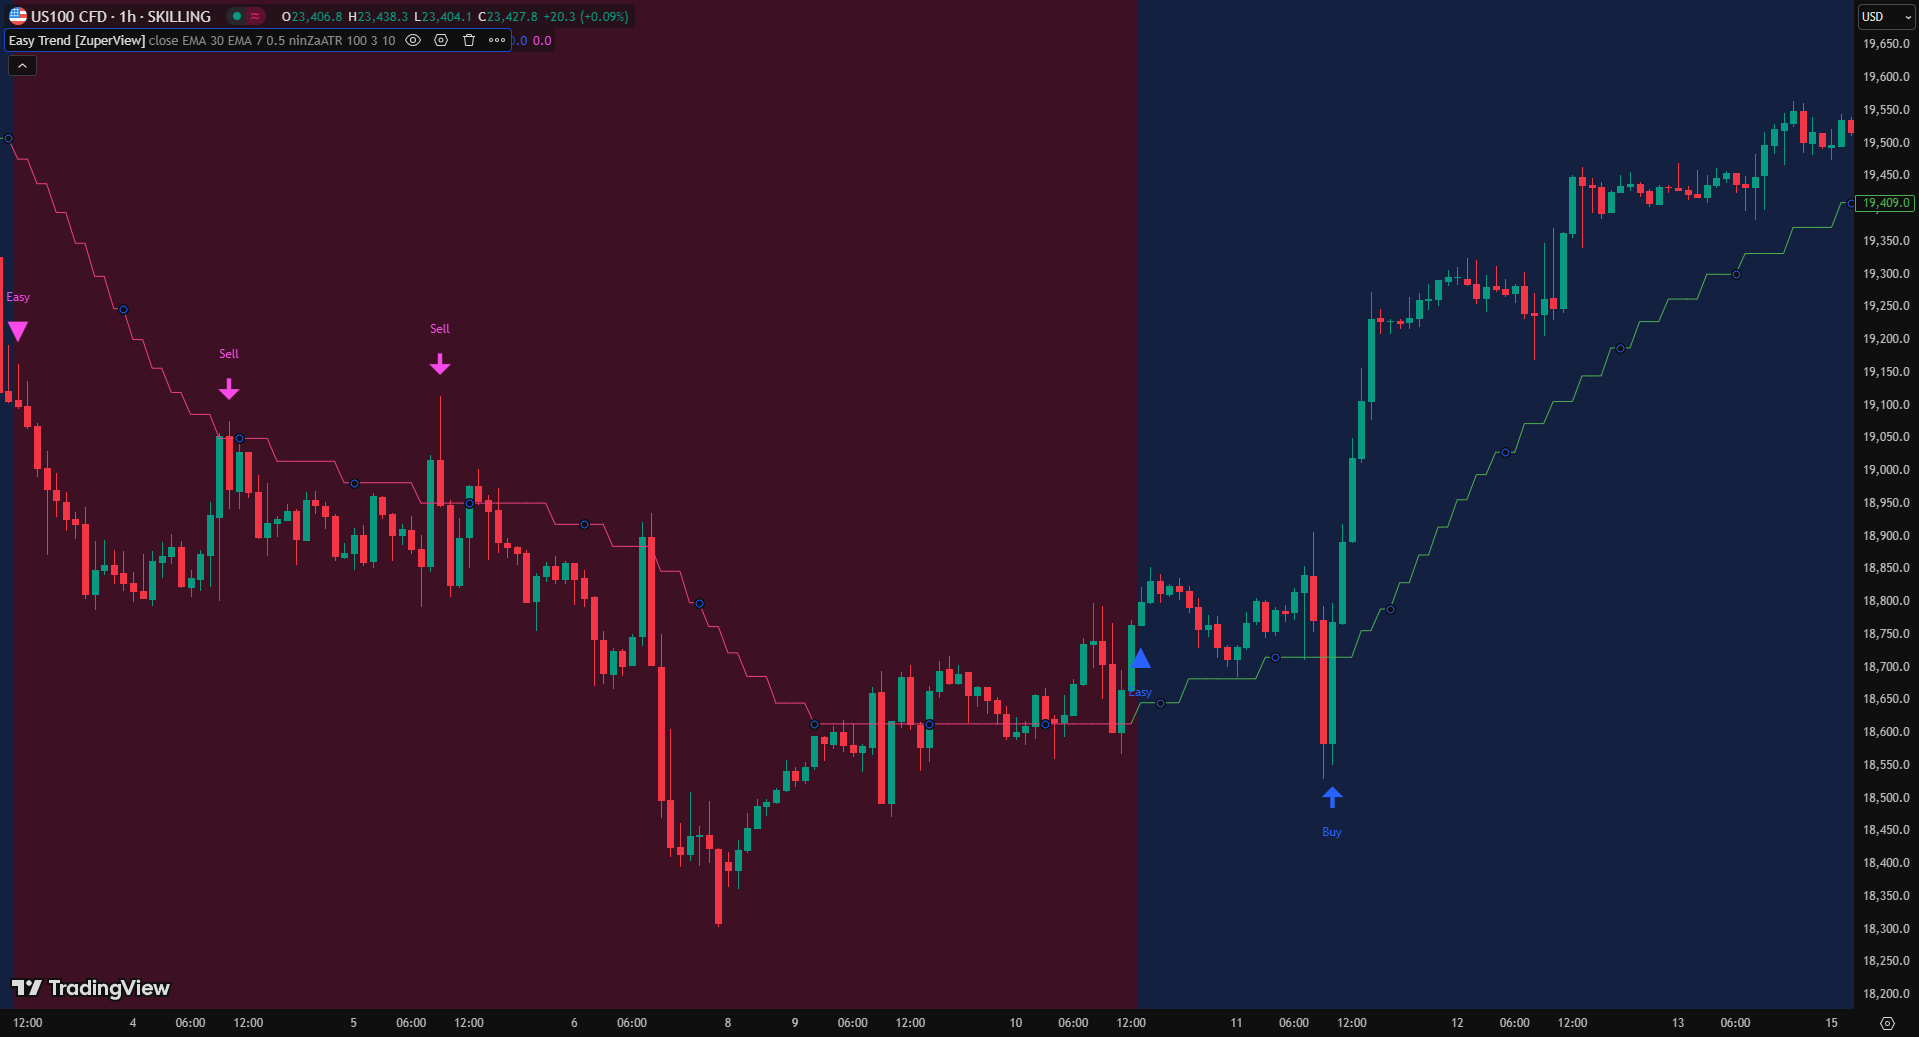
3. Easy Trend
Easy Trend focuses on smoothing price action with 11 moving average types (SMA, EMA, HMA, etc.) and 11 smoothing methods. This allows you to fine-tune trend detection and filter out short-term noise. The indicator generates pullback signals that align with the dominant trend, making it easier to enter positions with higher probability setups. Its responsiveness, especially when paired with ninZaATR, ensures accurate performance on both intraday and longer-term charts.

By combining these advanced and custom tools with traditional indicators, you can achieve a more complete trend-following system, improving clarity, reducing false signals, and optimizing entry and exit points.
How to choose the Best TradingView Trend indicator
With hundreds of options available, there is no single “perfect” tool. The best TradingView trend indicator always depends on your strategy, timeframe, and personal risk tolerance. Choosing the right indicator is about matching its strengths to the way you trade.
- For scalpers: Fast-moving markets require quick and responsive signals. Tools like the Exponential Moving Average (EMA) or custom indicators such as Solar Wave can capture short-term momentum shifts and provide timely entry/exit signals. These are especially useful when trading around volatility spikes or during market sessions with high activity.
- For swing traders: Patience and confirmation are key. Indicators like MACD and RSI help identify momentum changes and potential reversals, while advanced tools like Cosmik Z-TP provide dynamic support/resistance zones and pullback entries. This combination improves trade management and aligns entries with the broader trend-following strategy.
- For beginners: Simplicity often works best. Visual tools such as Easy Trend or a Simple Moving Average (SMA) make it easier to recognize whether price action is bullish or bearish without overcomplicating the chart. These indicators reduce noise and give a clear foundation for learning trend dynamics.
- For volume-based traders: Price action alone doesn’t always tell the full story. Adding VWAP (Volume Weighted Average Price) alongside a trend indicator helps confirm whether buyers or sellers are truly in control. This combination provides stronger context for institutional levels and intraday trading.
Final thoughts
Finding the best TradingView trend indicator is less about copying what others use and more about choosing tools that fit your trading style. Popular indicators like Moving Averages, RSI, MACD, and Bollinger Bands provide a strong foundation. But if you’re looking for something fresh, custom indicators such as Solar Wave, Cosmik Z-TP, and Easy Trend can give you a clearer, more structured view of market trends.
At the end of the day, the right trend indicator is the one that helps you stay consistent, disciplined, and confident in your trading decisions.