Skip to product information

Solar Wave
Sale price
$286
Regular price
$716
Product Description
How does Solar Wave help traders?
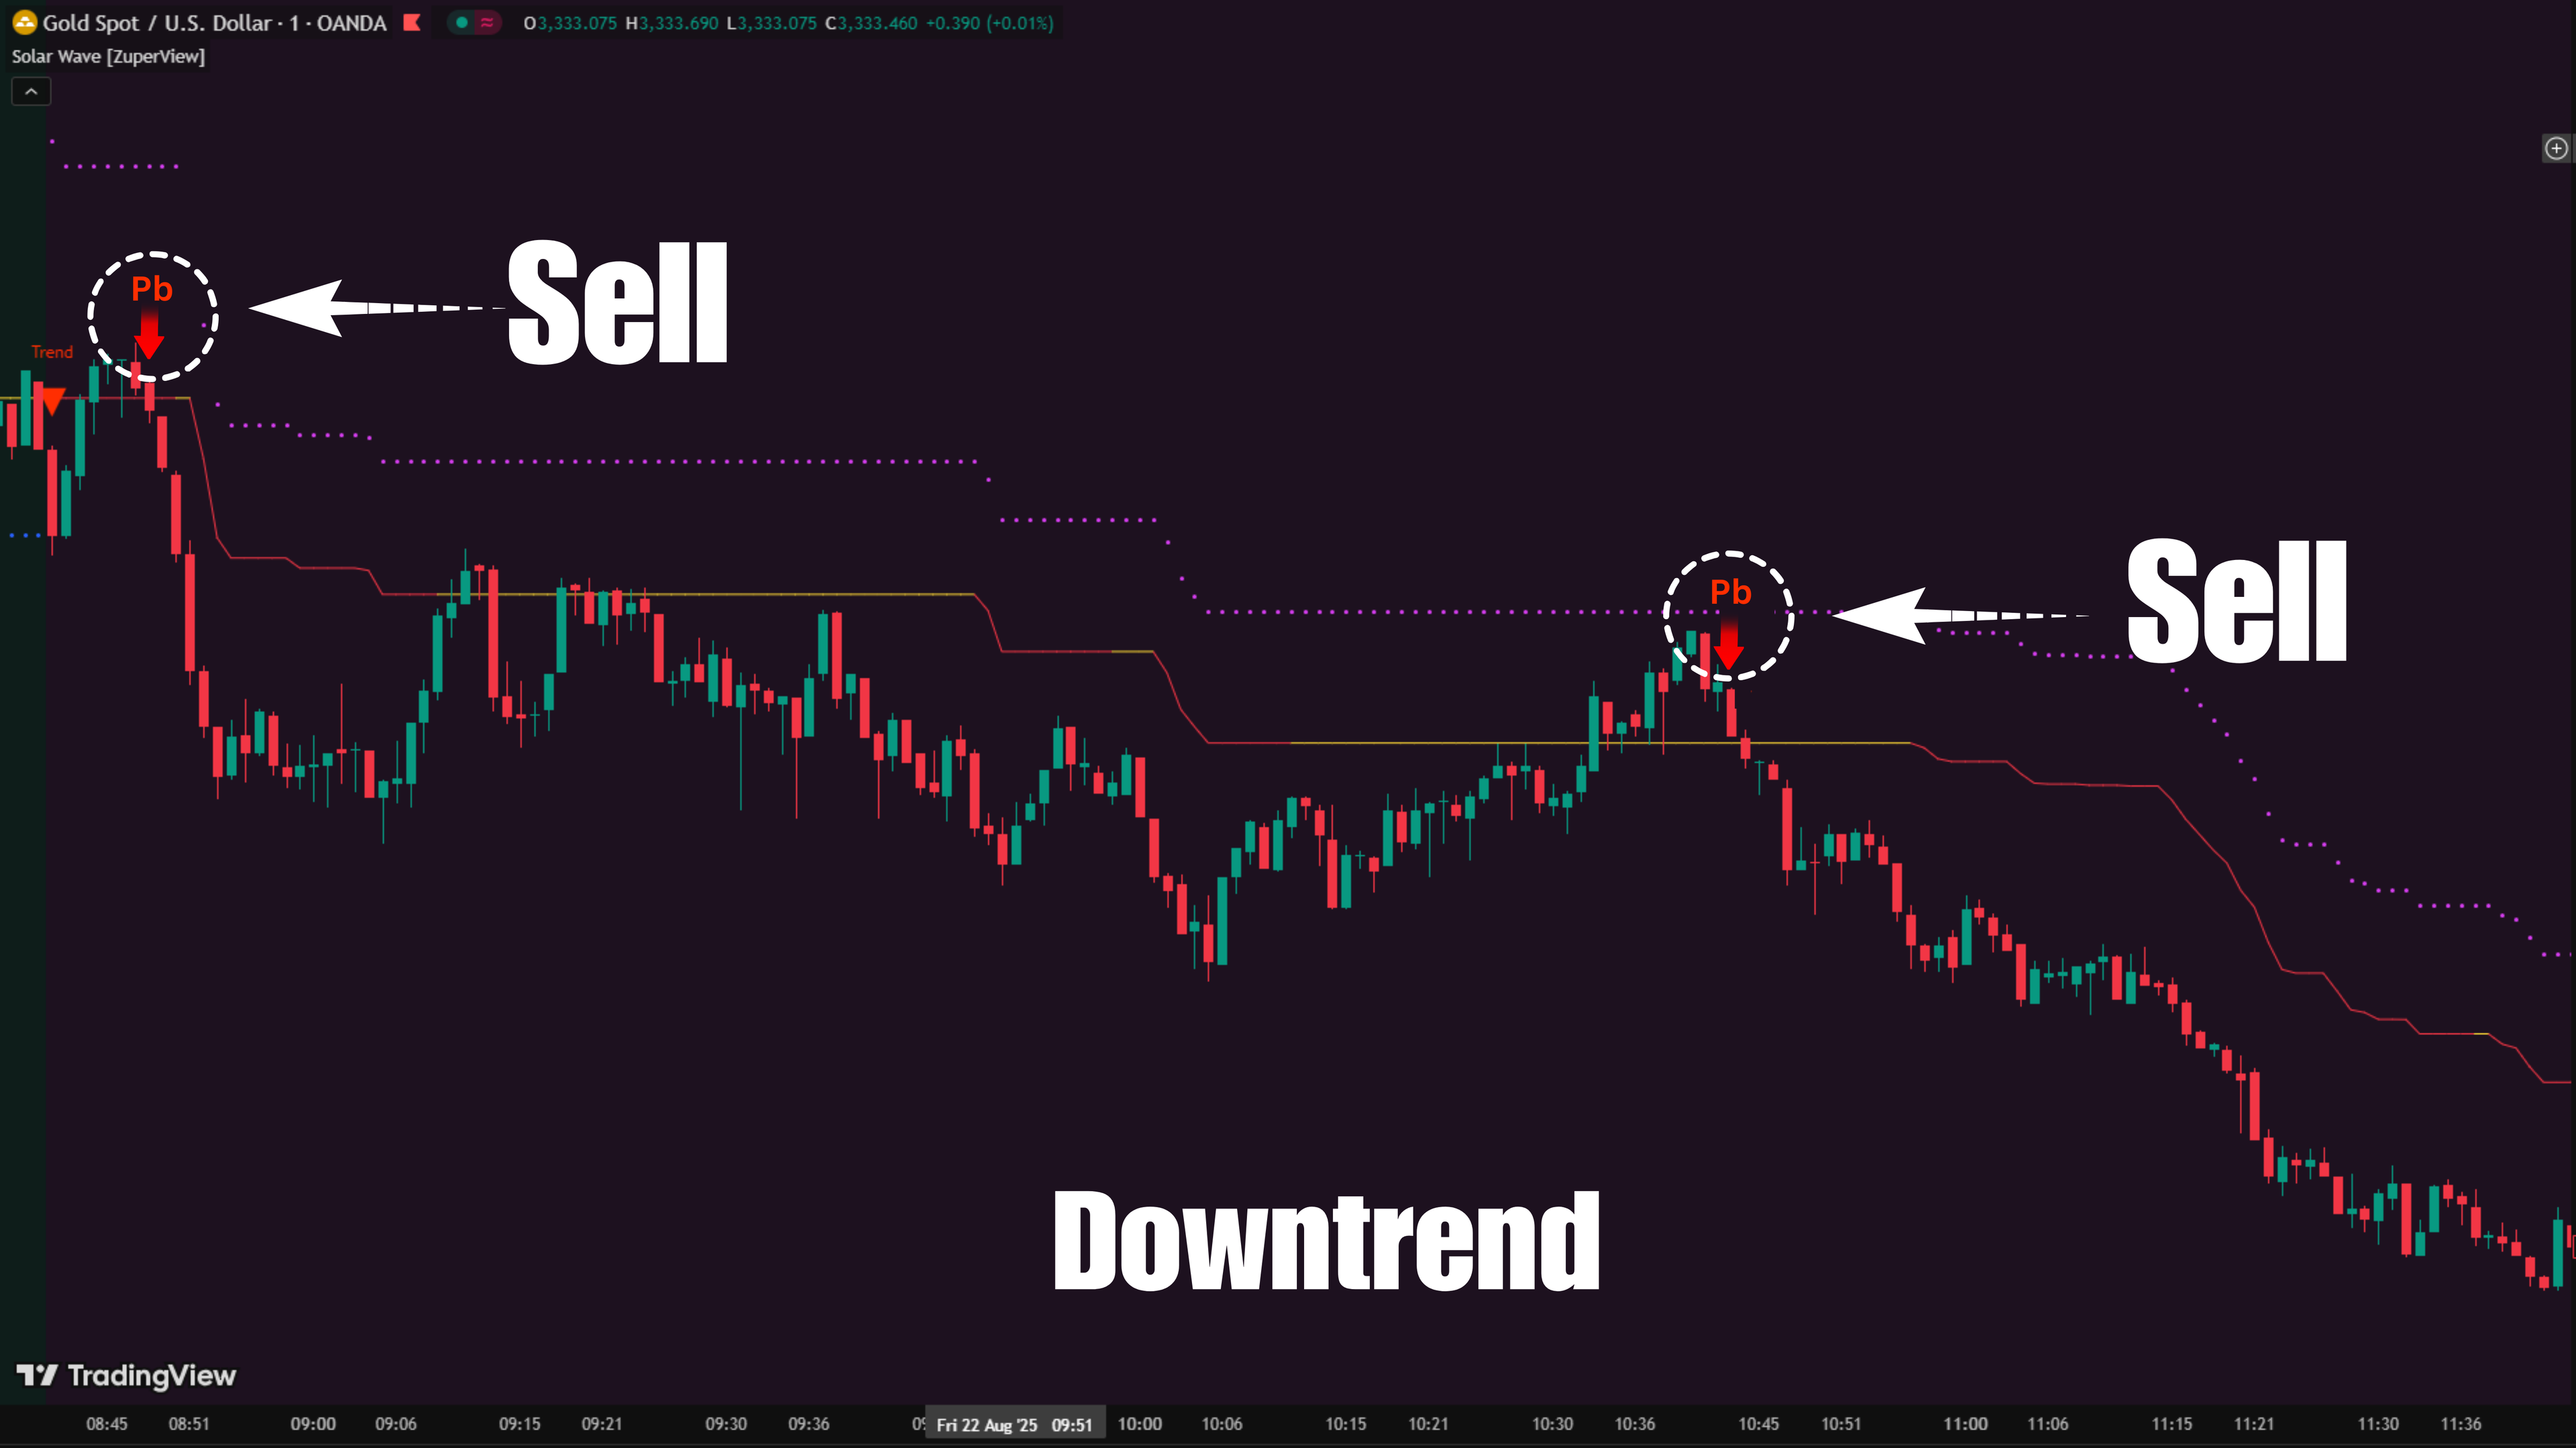
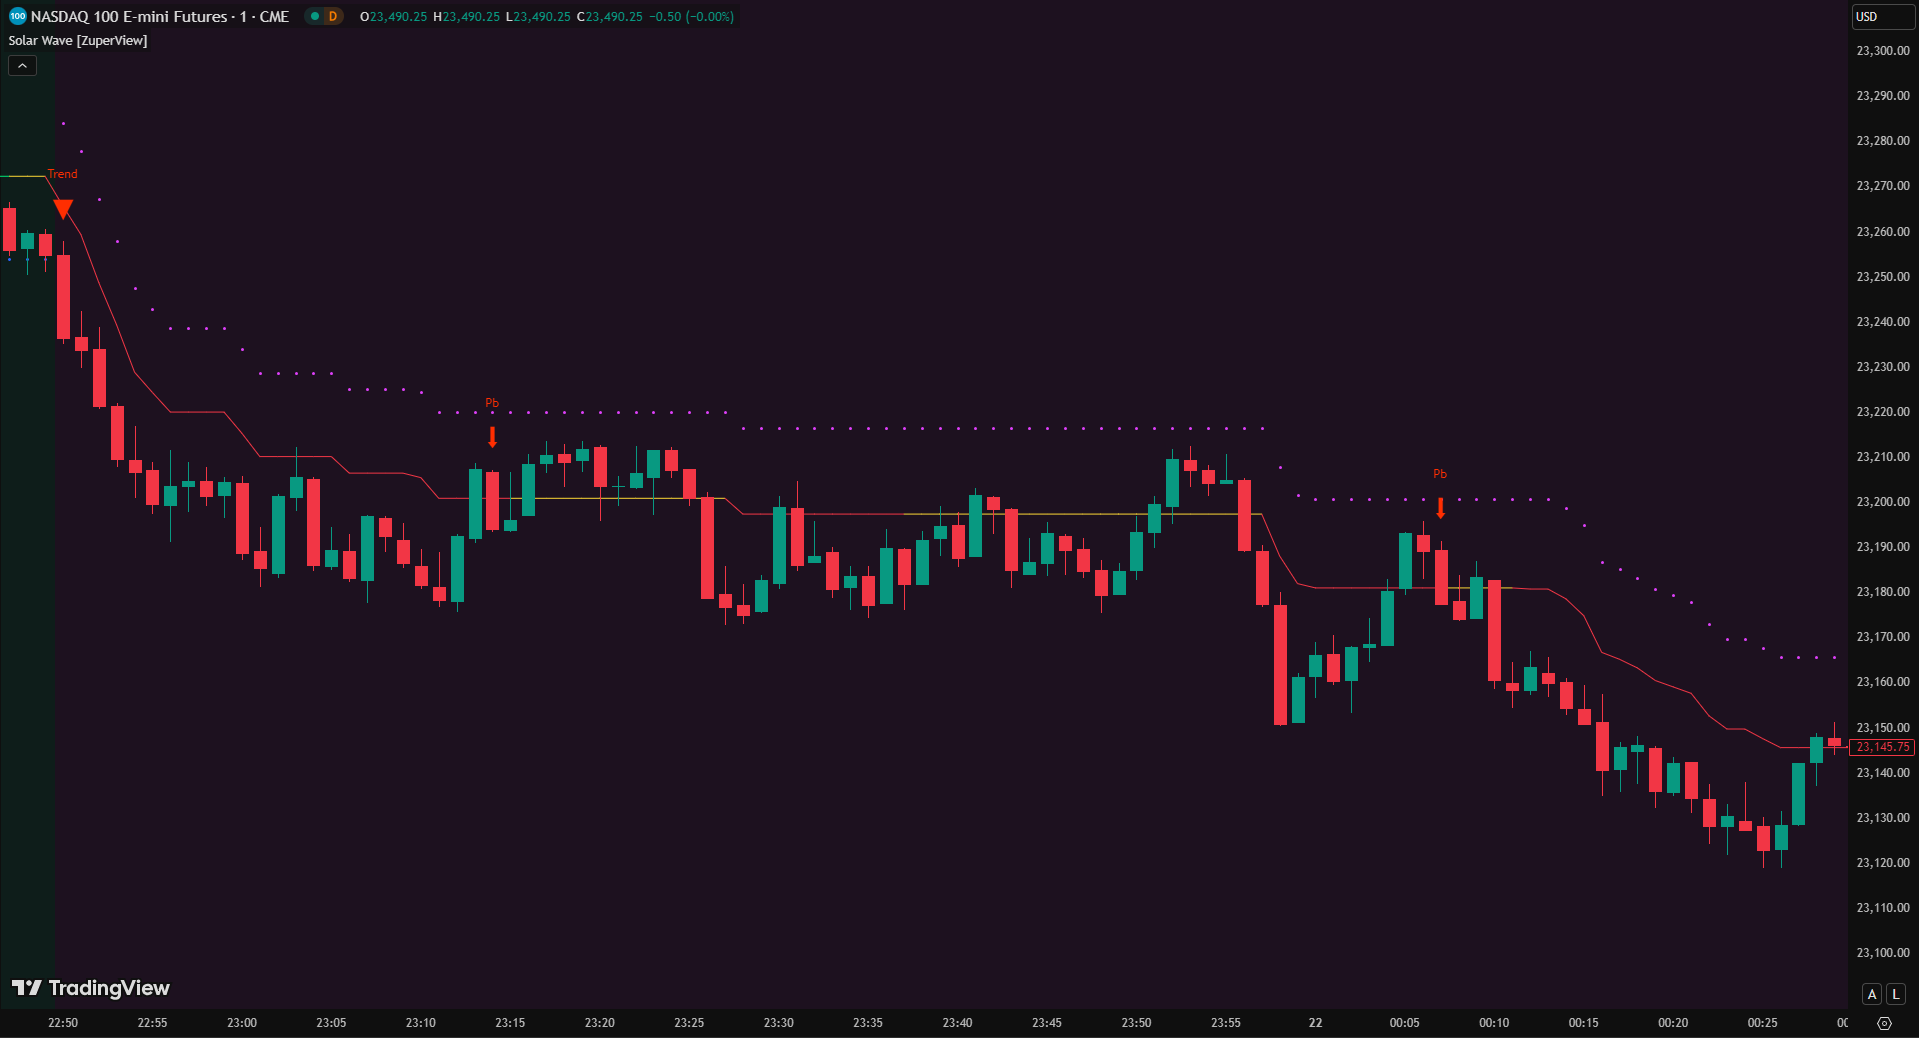
Solar Wave is a trend-trading indicator that shows both the direction and strength of the market in real time. It makes the market structure more transparent – not just whether price is moving up or down, but also whether that move is strong or weak.
With Solar Wave, you can focus on reliable pullbacks and manage stops objectively, keeping your trading aligned with the natural flow of the market.
Unlike traditional indicators that rely on moving averages or smoothing filters, Solar Wave works directly with price action and a refined volatility measure (ninZaATR) to capture the natural rhythm of the market without lag.
How to trade with Solar Wave
1. Identify the Market State
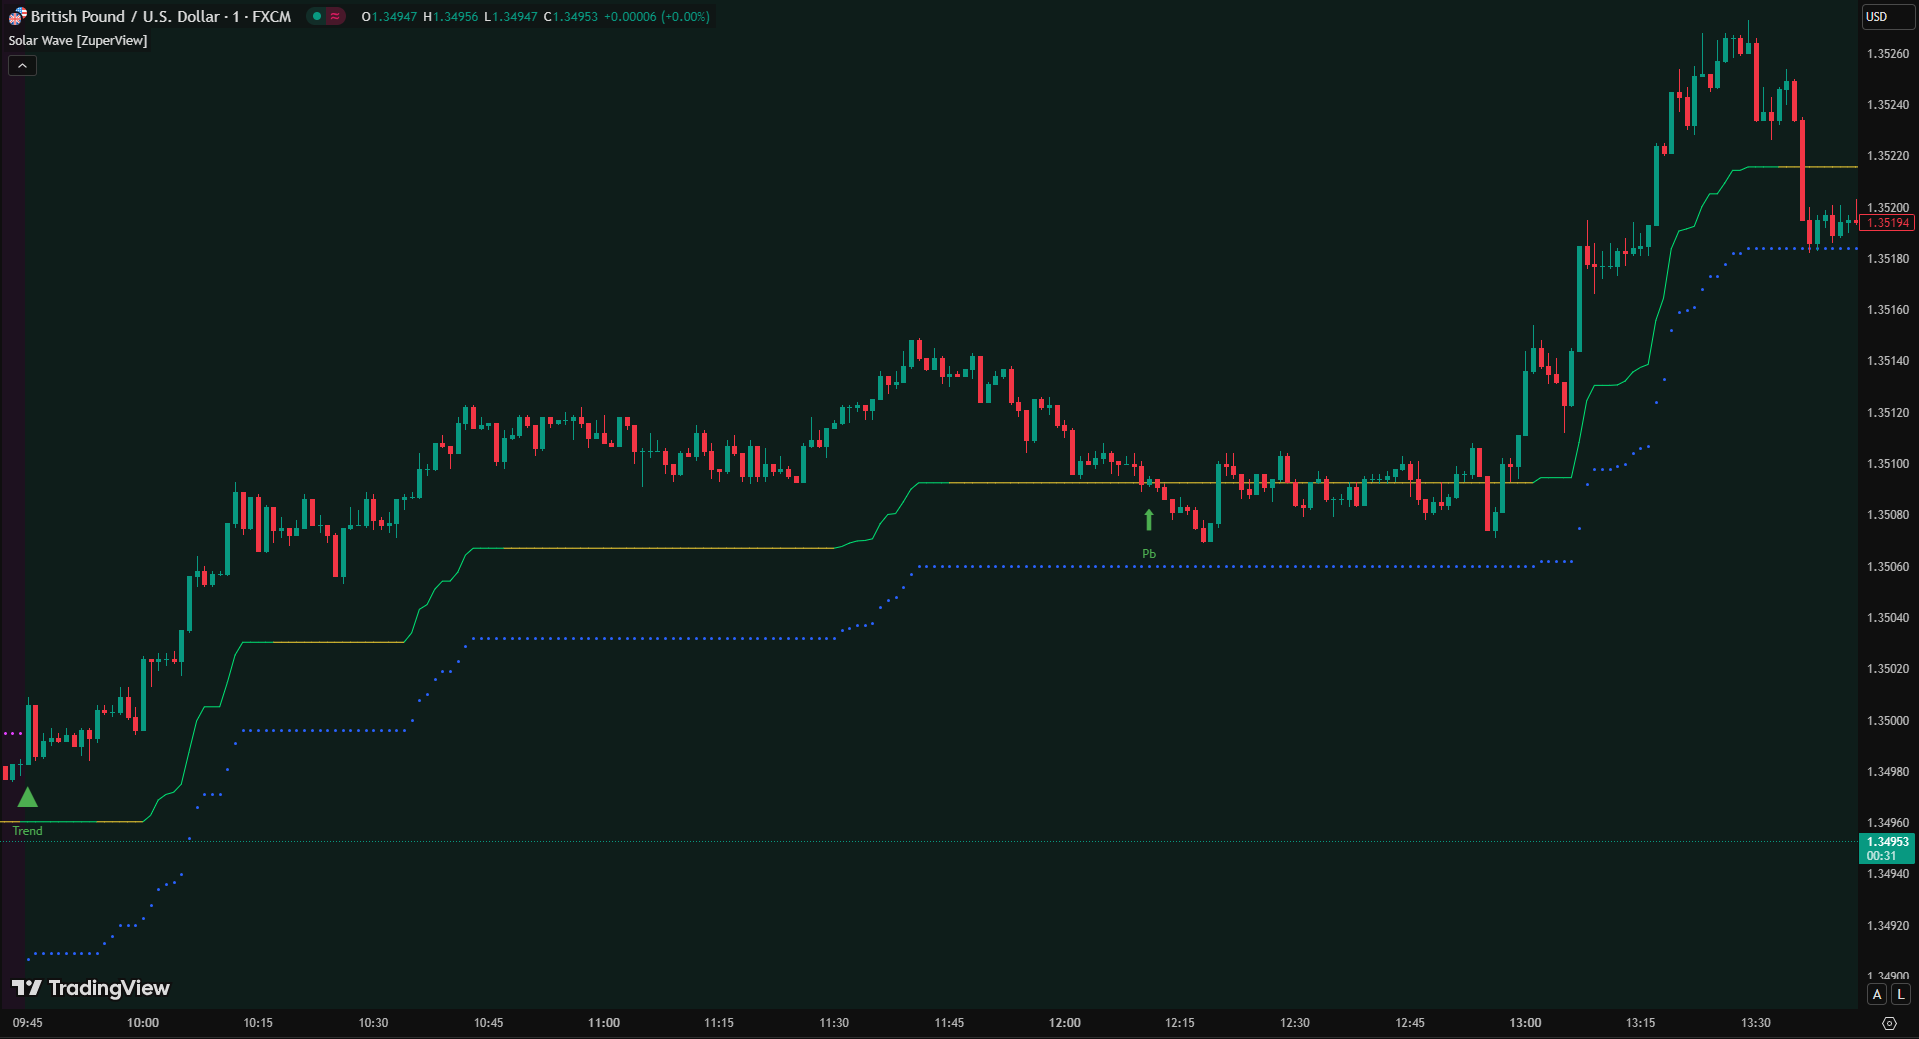
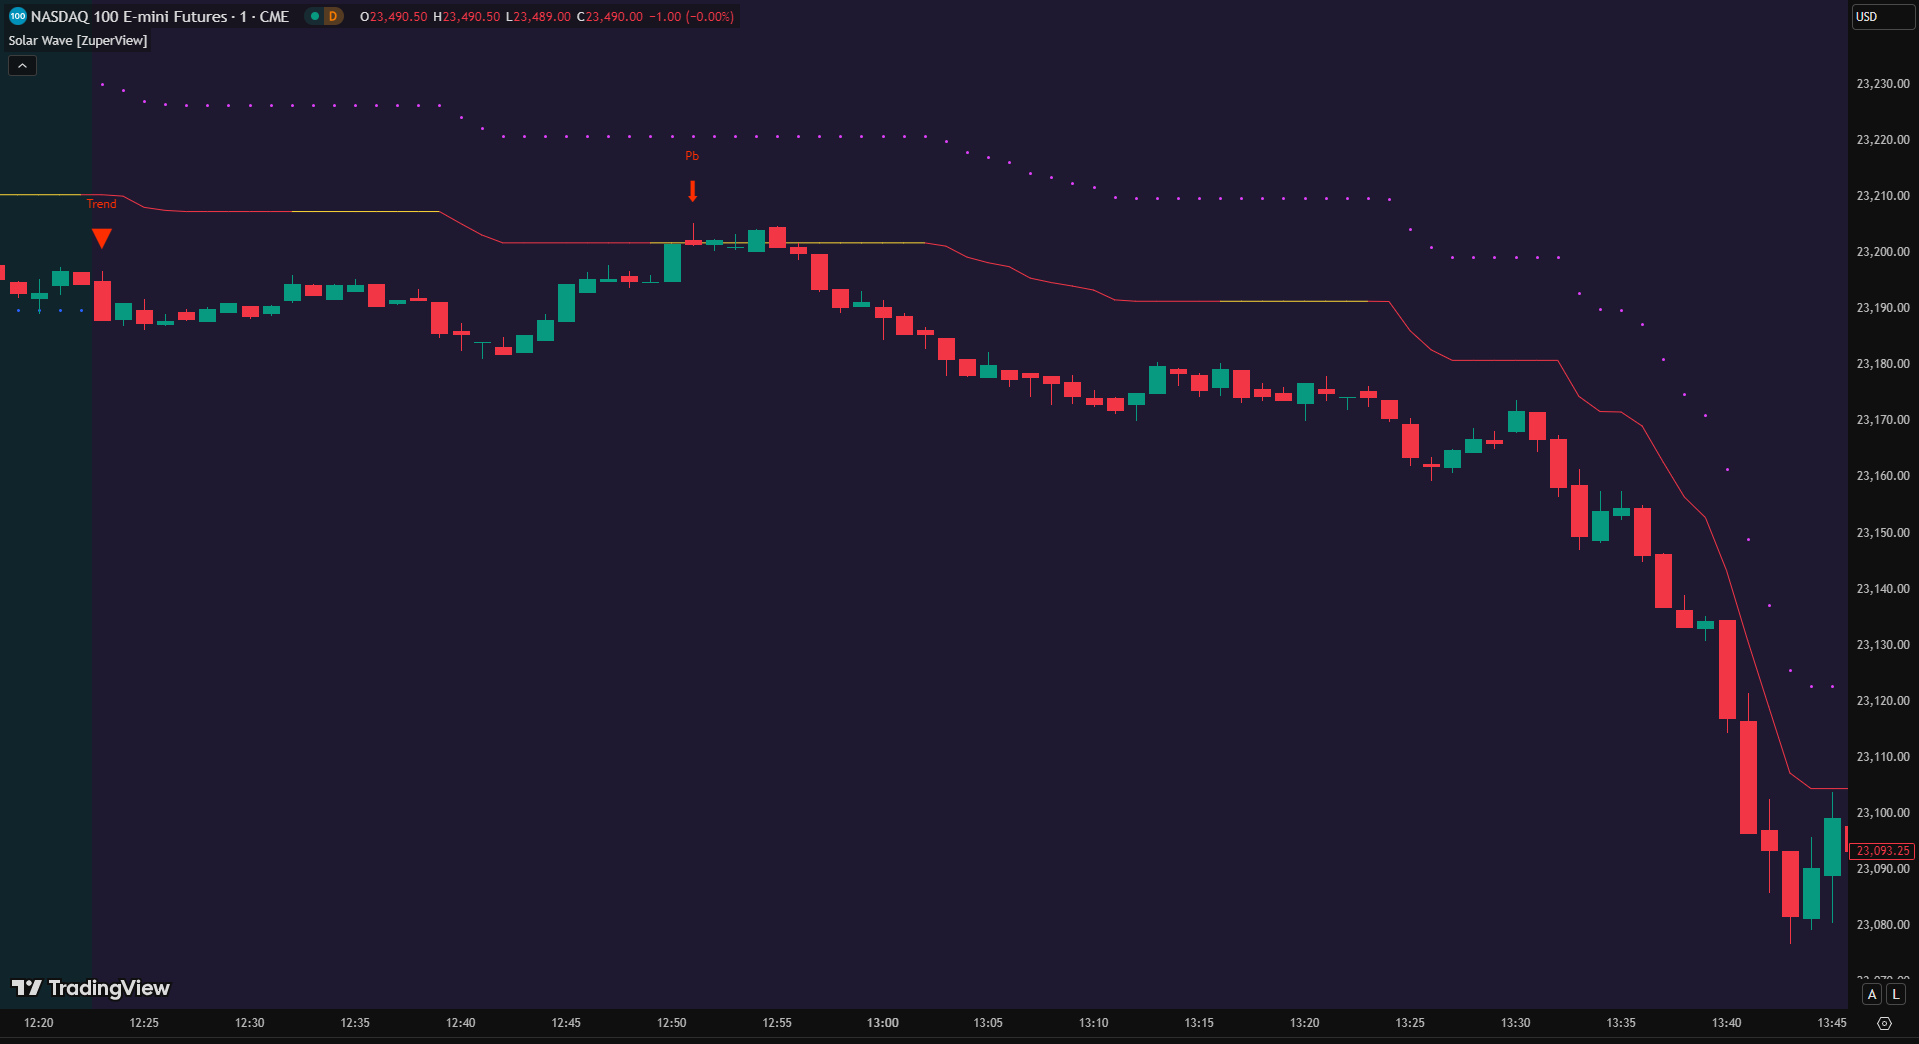
Check the Trend Vector:
- Strong upward slope = strong uptrend
- Strong downward slope = strong downtrend
- Flat = weak trend (correction or exhaustion)
Use the color cues, background highlights, and bar paints to confirm which of the four phases the market is in: strong/weak uptrend or strong/weak downtrend.
2. Spot Pullback opportunities
-
Wait for retracements instead of chasing extended moves.
-
Focus on the 1st and 2nd pullbacks in a new trend, as they are usually reliable for entries.
3. Ride the Trend with the Trailing Stop
Attach your stop to the "Trailing Stop" plot to follow the move until it truly ends, avoiding exits caused by emotions or minor fluctuations.
4. Watch the Trend steps
-
Watch shrinking “steps” as they signal fading momentum.
-
Treat this as an early warning to prepare for a potential trend finale and secure profits
Why traders find Solar Wave helpful
-
Clarity in every phase: Clearly distinguishes between strong and weak trends, both bullish and bearish
-
Objective trade management: Removes guesswork by providing a built-in trailing stop reference
-
Pullback focus: Highlights the most reliable moments to enter instead of chasing extended price action
-
Early warnings: Trend steps help you spot when momentum is running out before it’s too late
-
No lag: By relying on ninZaATR and price action only, Solar Wave stays responsive to real market behavior
Key Features of Solar Wave
-
Plot "Trend Vector" that shows both direction (uptrend or downtrend) and strength (strong or weak).
-
Plot "Trailing Stop" to manage dynamic stop trailing with ease.
-
Allow configuring "Trend Vector" and "Trailing Stop" using ninZaATR adjustment for flexibility.
-
Print trend steps and highlight step decreases as warnings of trend weakness.
-
Colorize bars based on four statuses: uptrend strong, uptrend weak, downtrend strong, downtrend weak.
-
Colorize "Trend Vector" according to the same four statuses for instant clarity.
-
Colorize "Trailing Stop" to distinguish clearly between uptrend and downtrend.
-
Paint background shading to visually confirm whether the market is in uptrend or downtrend.
-
Trigger alerts when a trend start, pullback, or strengthening occurs.
-
Print markers directly on the chart at trend start, pullback, or strengthening points.
Changelog
✖