Skip to product information

Z-Candle Range 4U
FREE
Product Description
Overview
Z-Candle Range 4U highlights the strongest and weakest candles within a selected range, helping traders visualize market volatility and momentum shifts at a glance.
It focuses on candle structure to reveal where price movement is expanding, compressing, or losing strength.
Core concept
Not all candles carry the same weight in trading. Some represent strong institutional activity, while others show hesitation or equilibrium.
By comparing both the full candle range (High–Low) and the candle body (Open–Close), Z-Candle Range 4U automatically detects the most extreme candles in a given number of bars (n), providing a fast, objective read of volatility and directional pressure.
Main functions
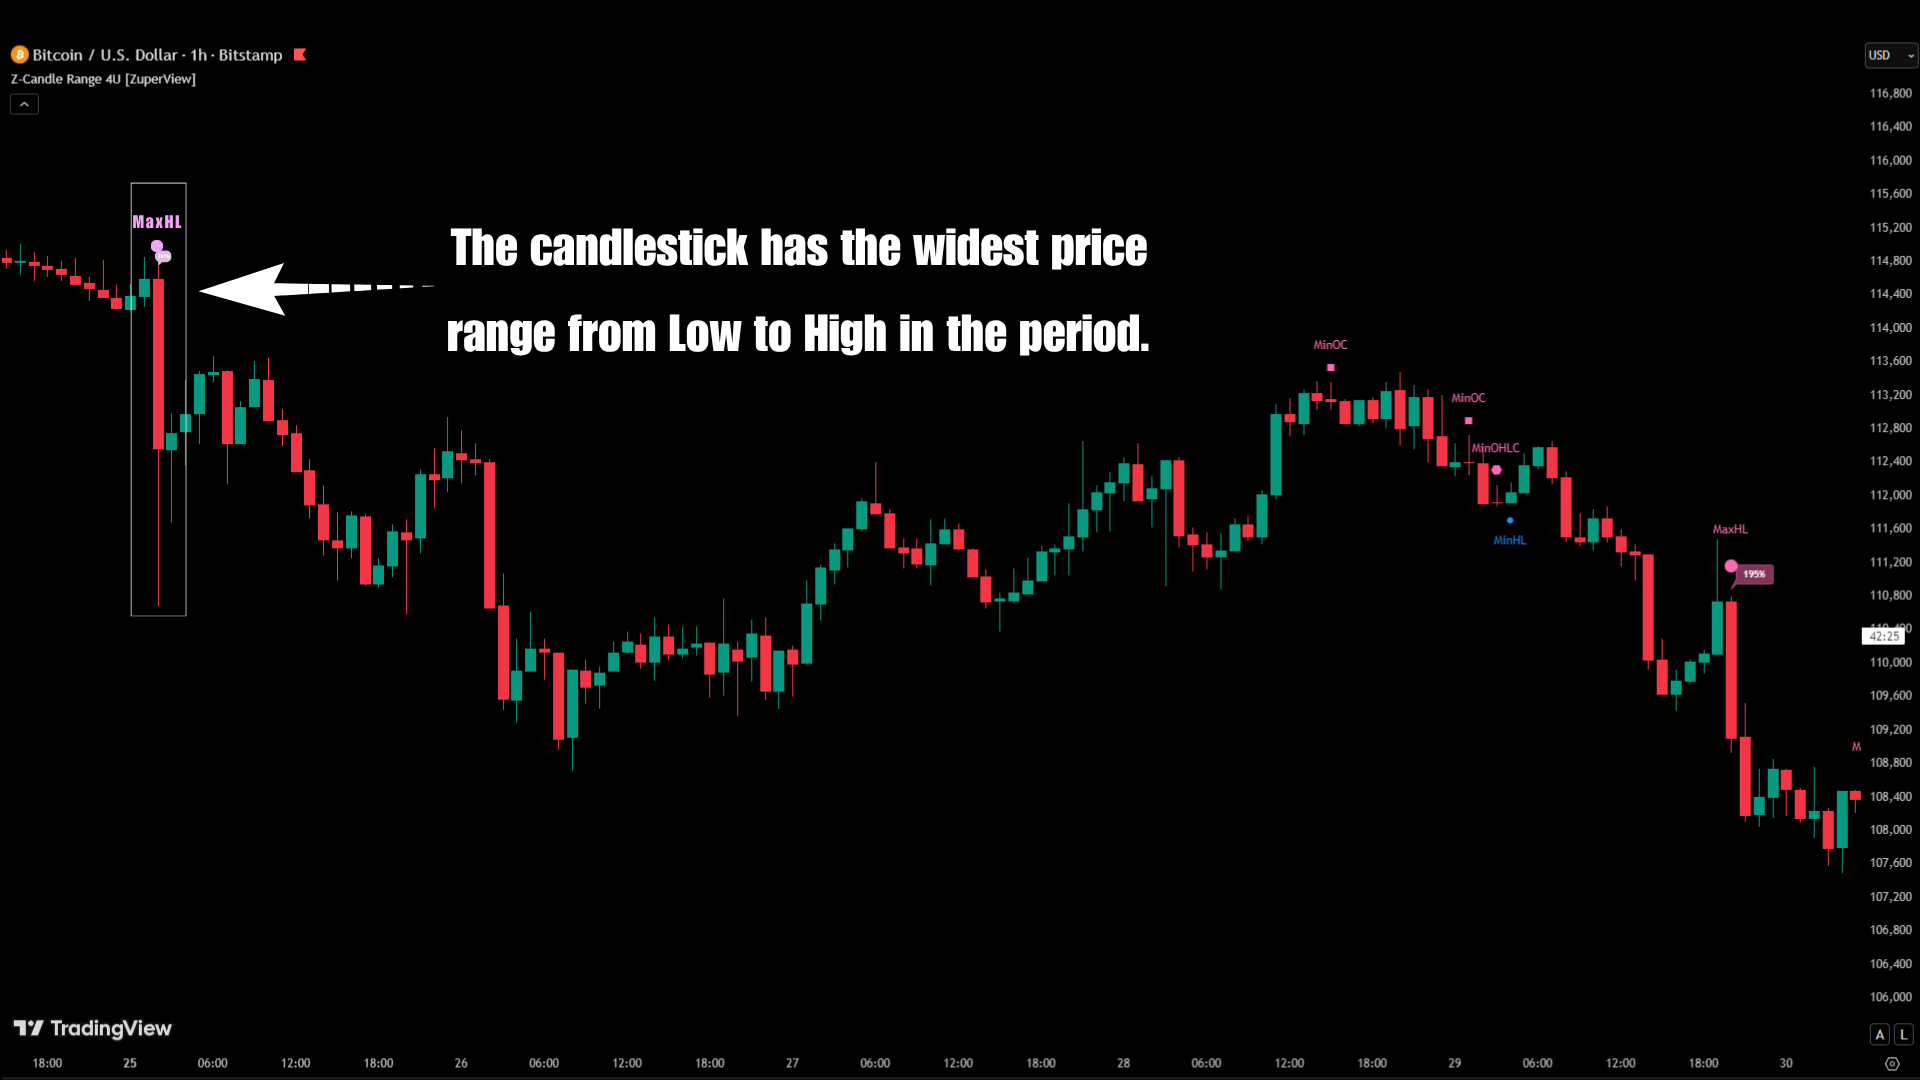
- Max Range: Detects the candle with the widest High–Low range → strong volatility expansion.
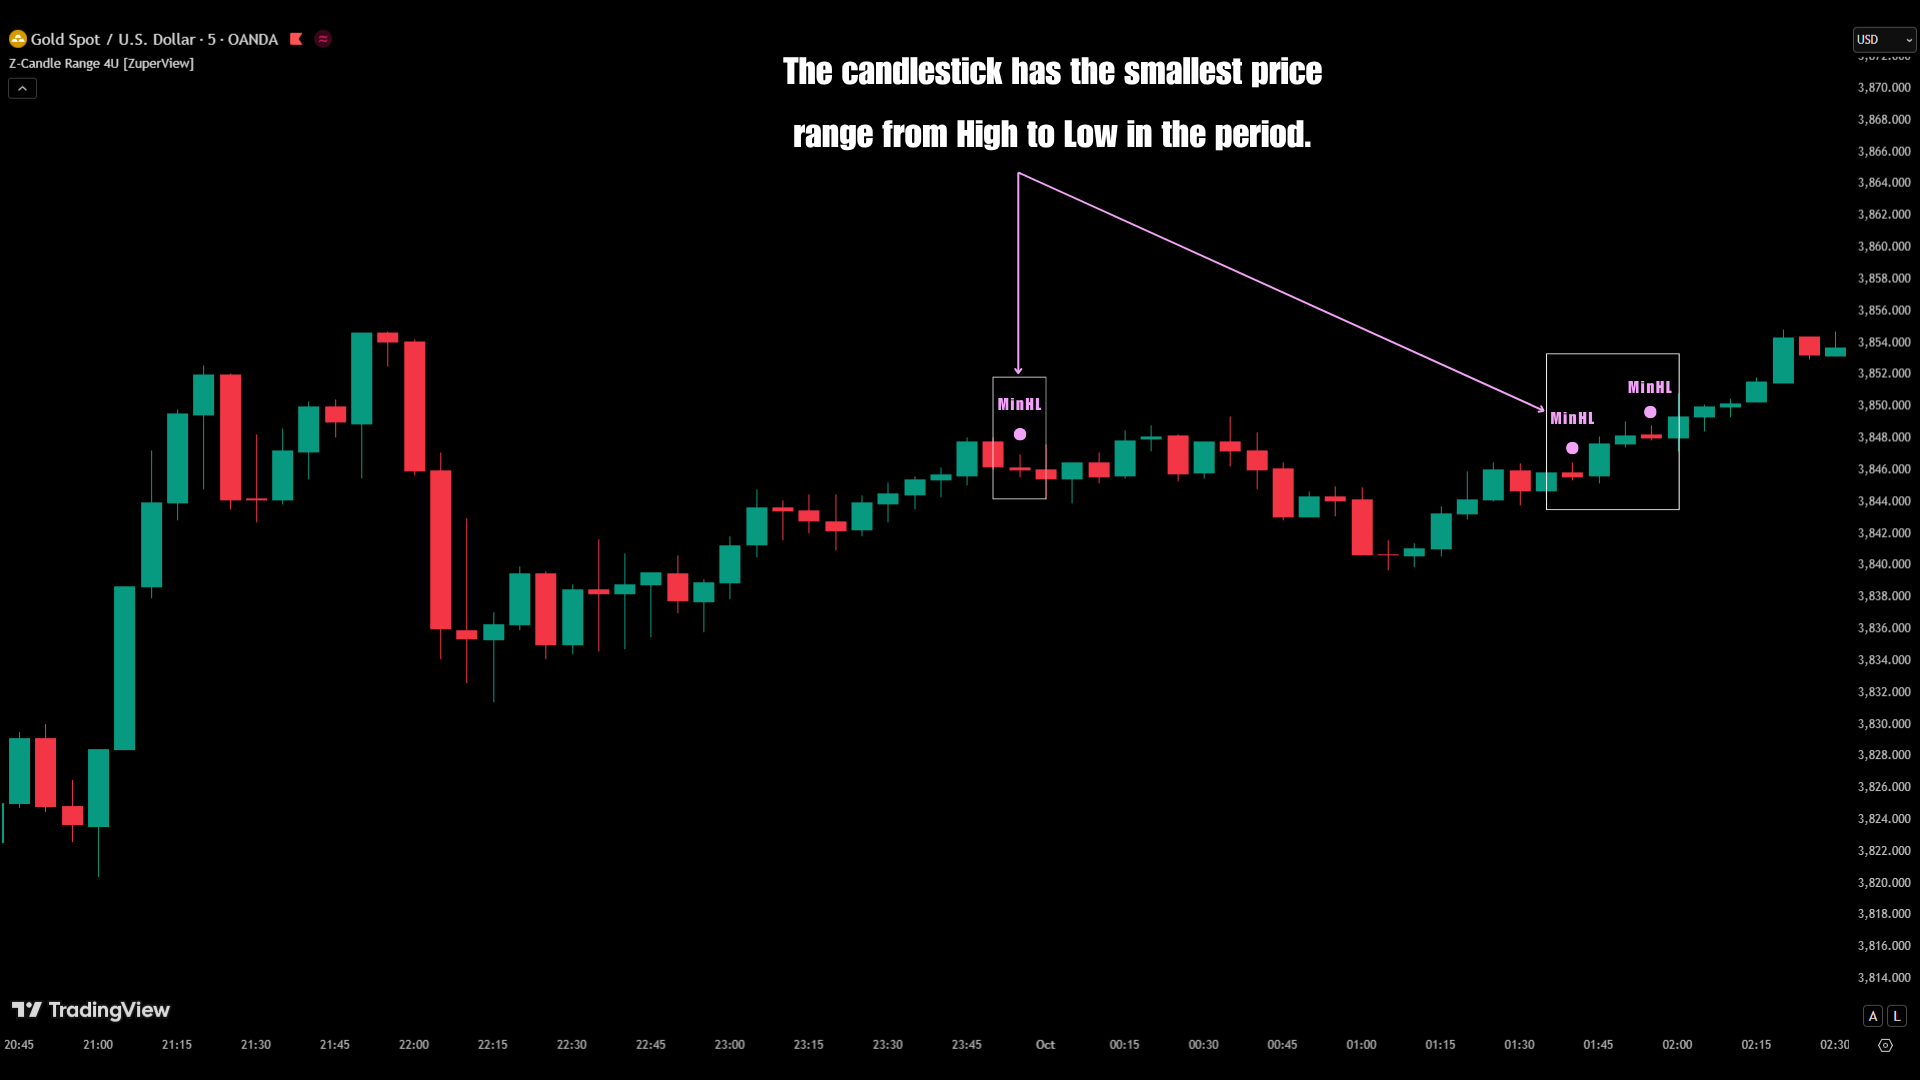
- Min Range: Detects the candle with the smallest High–Low range → price compression or accumulation.
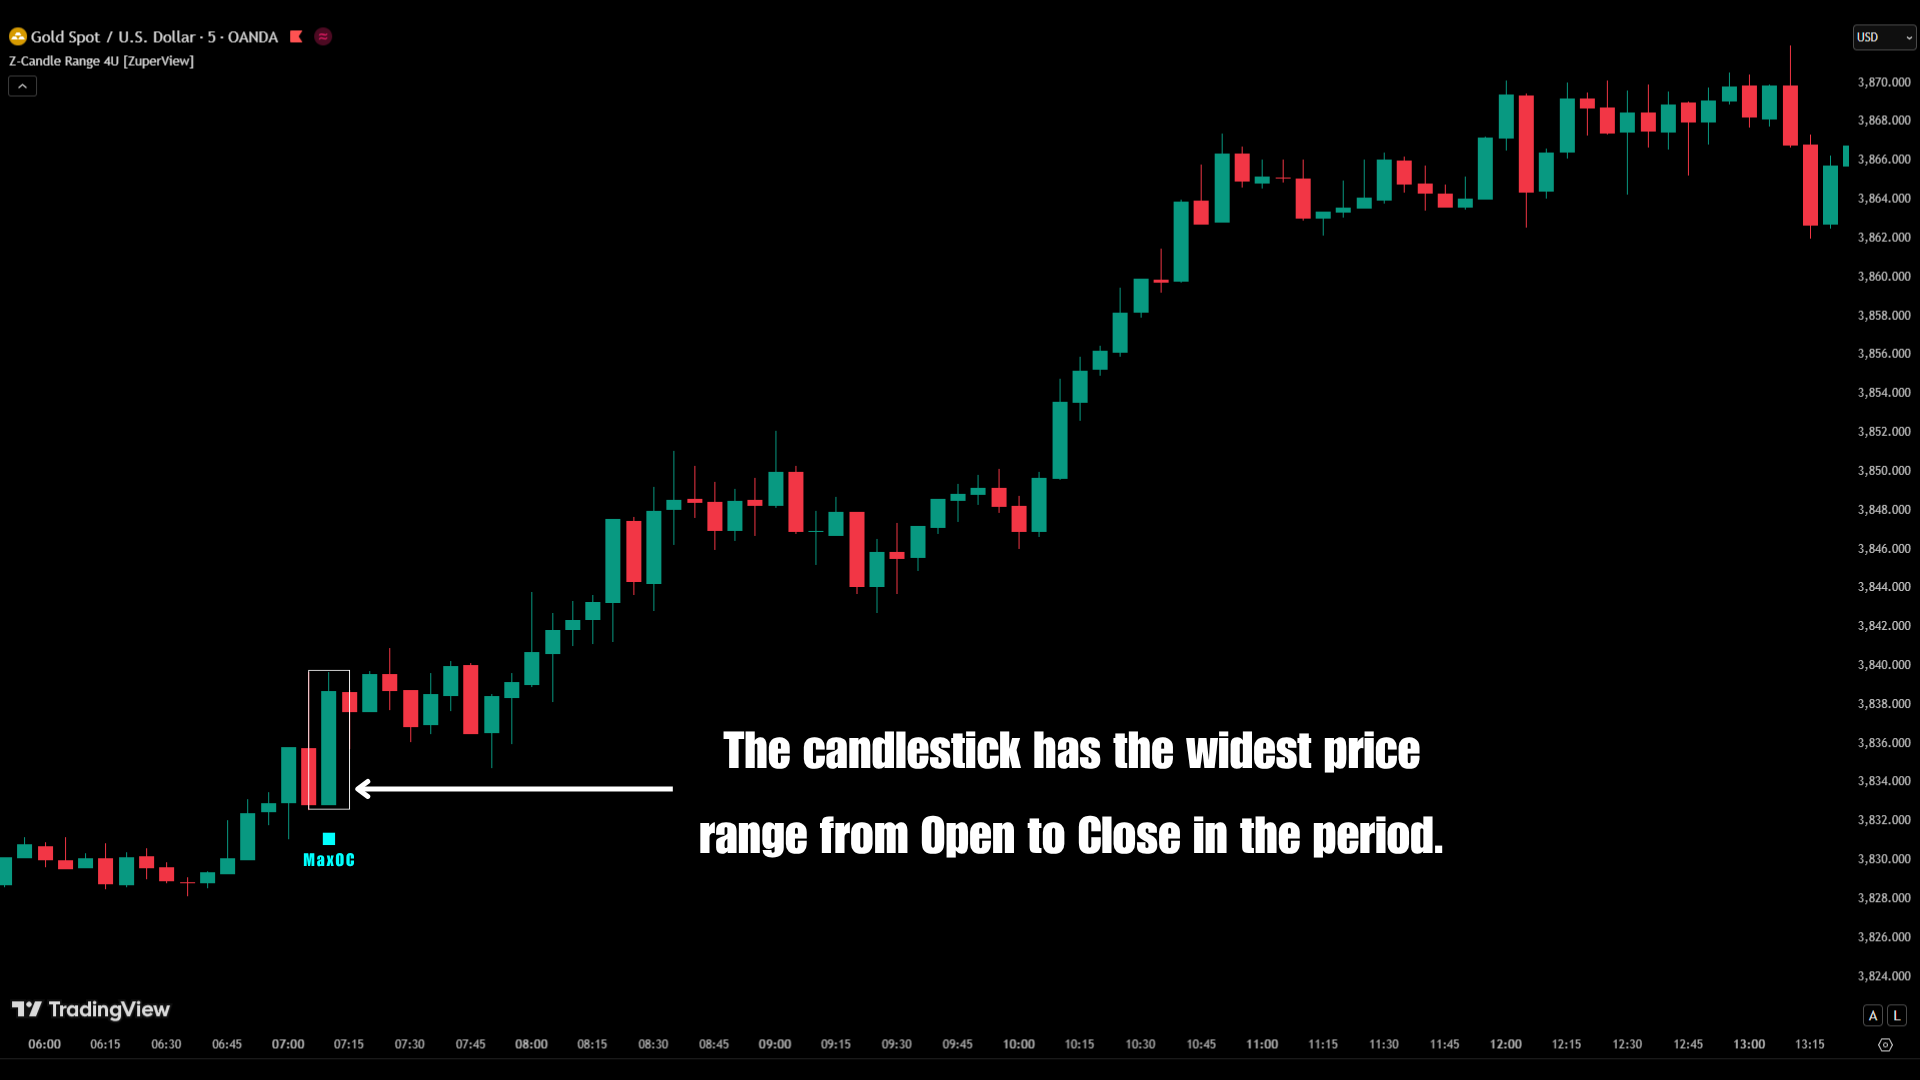
- Max Body: Identifies the candle with the longest Open–Close distance → strong directional push (impulse).
- Min Body: Identifies the candle with the shortest body → indecision or balance between buyers and sellers.
Applications in trading
Z-Candle Range 4U isn’t just about measuring candle size. It’s about reading the rhythm of volatility and momentum in real time. Here’s how you can put it to work on their charts:
-
Detect volatility shifts before breakouts or reversals
Expanding candle ranges after a quiet phase signal rising volatility. The indicator helps you spot these early signs of breakout or reversal setups.
-
Spot strong momentum (breakout or impulse bars)
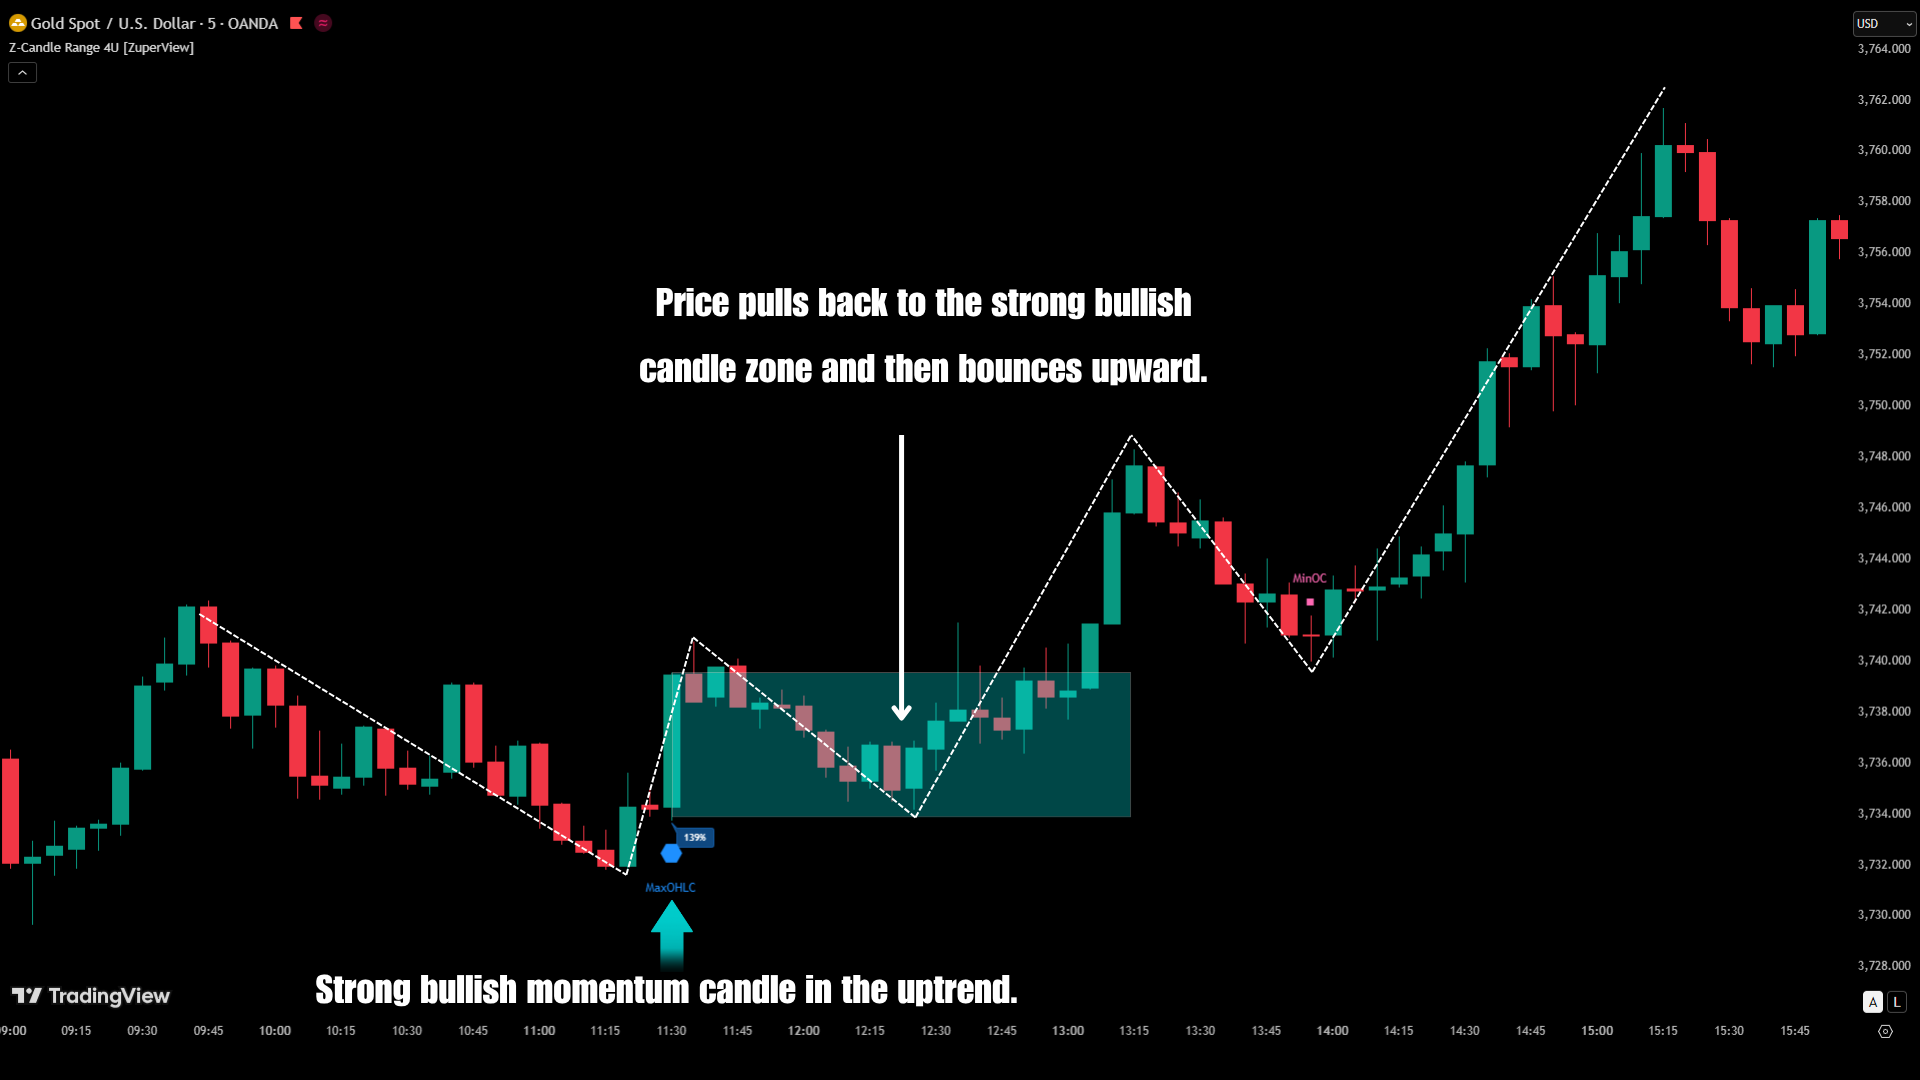
Candles with the longest bodies reveal strong directional momentum. These impulse bars often mark the start of high-probability breakouts.
-
Identify accumulation and volatility contraction phases
The smallest-range candles show tightening volatility, the “calm before the storm” that precedes major breakout moves. -
Recognize market pauses before major moves
Small-body, wide-range candles indicate indecision. Z-Candle Range 4U highlights these pause zones, often precursors to strong moves.
-
Assess momentum and trend strength
Comparing candle sizes lets you gauge each wave’s energy. Shrinking ranges mean fading strength, expanding ones confirm continuation.
-
Visualize market behavior easily
Key candles are highlighted directly on your chart, making volatility and momentum instantly readable without complex analysis.
The takeaway
Z-Candle Range 4U brings clarity to what’s often hidden in price action. By highlighting extreme candles in both range and body size, it helps traders instantly see where volatility expands, momentum builds, or the market pauses before its next move.
Whether you’re preparing for breakouts, studying momentum structure, or refining your visual strategy, this indicator makes reading market behavior simple, precise, and intuitive.
Changelog
✖